【R】日本の火山
2020年5月13日
おもしろいデータ表現を見つけたので引用します。Dr. Shandiya Balasubramaniamさんの、データです。こちらがソースです。
日本とその周辺海域の火山をその高さとともにプロットしています。
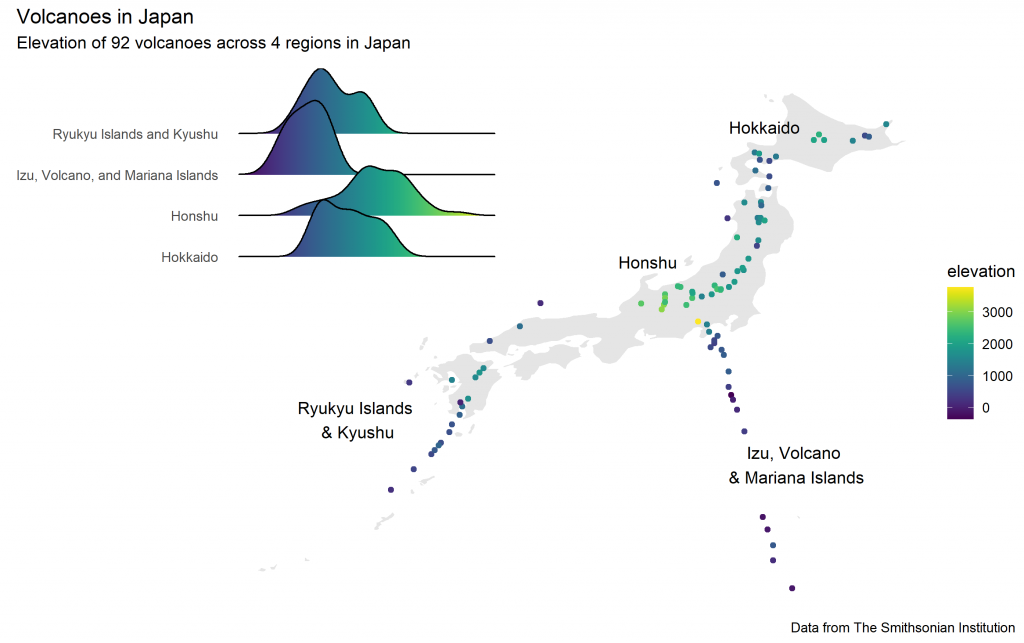
これだけたくさん火山があれば、地震も多いですよね。ちなみにRのコードは以下の通りです。一部訂正してありますが、ほぼ原文のままです。このコードでは、ggjoyというパッケージを読み込まないと動作しませんでした。
# title: Volcanoes in Japan
# author: Shandiya Balasubramaniam
# date: 11 May 2020
# description: distribution and elevation of 92 volcanoes in Japan


# load packages
library(tidyverse)
library(maps)
library(patchwork)
library(viridis)
library(hrbrthemes)
library(ggjoy)

# read in the dataset
volcano <- readr::read_csv('https://raw.githubusercontent.com/rfordatascience/tidytuesday/master/data/2020/2020-05-12/volcano.csv')
write.csv(volcano, "volcano.csv")
glimpse(volcano)

# filter Japanese data only
japan_volc <- volcano %>%
  filter(country == "Japan")

# load map for Japan
japan <- map_data("world", region = "Japan")

# ridgeline plot of elevation across subregions
p1 <- ggplot() +
  geom_density_ridges_gradient(
    data = japan_volc,
    aes(x = elevation, y = subregion, fill = stat(x))
  ) +
  scale_fill_viridis() +
  theme_minimal() +
  theme(
    legend.position = "none",
    panel.grid = element_blank(),
    axis.title.y = element_blank(),
    axis.text.x = element_blank(),
    axis.title.x = element_blank()
  )

# map of volcano locations, colour coded by elevation
p2 <- ggplot() +
  geom_polygon(
    data = japan,
    aes(x = long, y = lat, group = group),
    fill = "grey",
    alpha = 0.4
  ) +
  geom_point(
    data = japan_volc,
    aes(x = longitude, y = latitude, colour = elevation),
  ) +
  scale_color_viridis() +
  labs(
    y = "latitude",
    x = "longitude"
  ) +
  annotate("text", x = 141, y = 44, label = "Hokkaido") +
  annotate("text", x = 137, y = 38, label = "Honshu") +
  annotate("text", x = 127, y = 31, label = "Ryukyu Islands\n & Kyushu") +
  annotate("text", x = 142, y = 29, label = "Izu, Volcano\n & Mariana Islands") +
  theme_void()

# specify layout for patchwork
layout <- c(
  area(1, 1, 2, 2),
  area(1.5, 1.5, 5, 5)
)

# put it all together
p1 + p2 +
  plot_layout(design = layout) +
  plot_annotation(
    title = "Volcanoes in Japan",
    subtitle = "Elevation of 92 volcanoes across 4 regions in Japan",
    caption = "Data from The Smithsonian Institution"
  )

ggsave(filename = "Japan_volcanoes.png")
