【R】ggchartsで楽々Chart
2020年5月14日
ggchartsというパッケージがCRANで公開になりました。ggplotを使用した時とggchrtsを使用した時の比較がありますが、本当に楽々ですね!
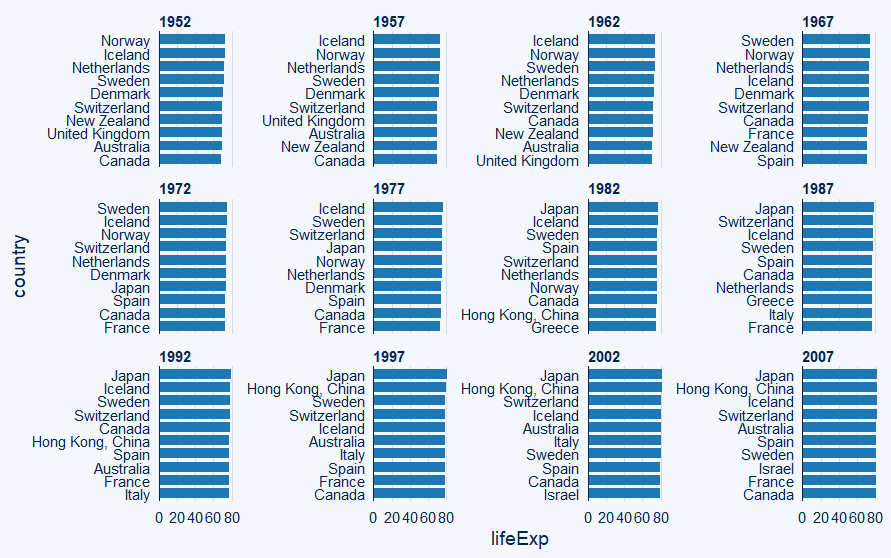
試しに世界の平均余命の変遷をチャートで見てみました。
Rのコードは次の通り。本当に簡単!
library(dplyr)
library(ggplot2)
library(ggcharts)
library(gapminder)

dat<-gapminder

bar_chart(dat, country, lifeExp, facet = year, top_n = 10)