【R】Ubuntu に Shiny-serverをインストール
2020年6月24日
タイトルの通り、UbuntuにShiny-server をインストールします。
1. Rのインストール
Ubuntuのコードネーム取得。使っているのは、Ubuntu16.04なのでxenial
$ lsb_release -cs
xenialダウンロード先を/etc/apt/sources.listに登録。
$ sudo vim /etc/apt/sources.list
(末尾に以下を追加)
deb https://cran.rstudio.com/bin/linux/ubuntu xenial-cran40/
ダウンロード先の公開鍵を登録。
$ sudo apt-key adv --keyserver keyserver.ubuntu.com --recv-keys E298A3A825C0D65DFD57CBB651716619E084DAB9Rをインストール
$ sudo apt update
$ sudo apt install r-base
バージョンの確認
$ R
> version
               _
platform       x86_64-pc-linux-gnu
arch           x86_64
os             linux-gnu
system         x86_64, linux-gnu
status
major          4
minor          0.1
year           2020
month          06
day            06
svn rev        78648
language       R
version.string R version 4.0.1 (2020-06-06)
nickname       See Things Now
パッケージのインストール
$ sudo su - -c "R -e \"install.packages('<<Package>>>', repos='http://cran.rstudio.com/')\""
パッケージのアンインストール
$ sudo su - -c "R -e \"remove.packages('<<Package>>')\""【参考】
・最新のRをUbuntuにインストール
・UBUNTU PACKAGES FOR R
2. Shiny server のインストール
RのShinyパッケージをインストール。
$ sudo su - \
-c "R -e \"install.packages('shiny', repos='https://cran.rstudio.com/')\""
Shiny server をインストール。
$ sudo apt-get install gdebi-core
$ wget https://download3.rstudio.org/ubuntu-14.04/x86_64/shiny-server-1.5.14.948-amd64.deb
$ sudo gdebi shiny-server-1.5.14.948-amd64.deb
RMarkdownをインストール。
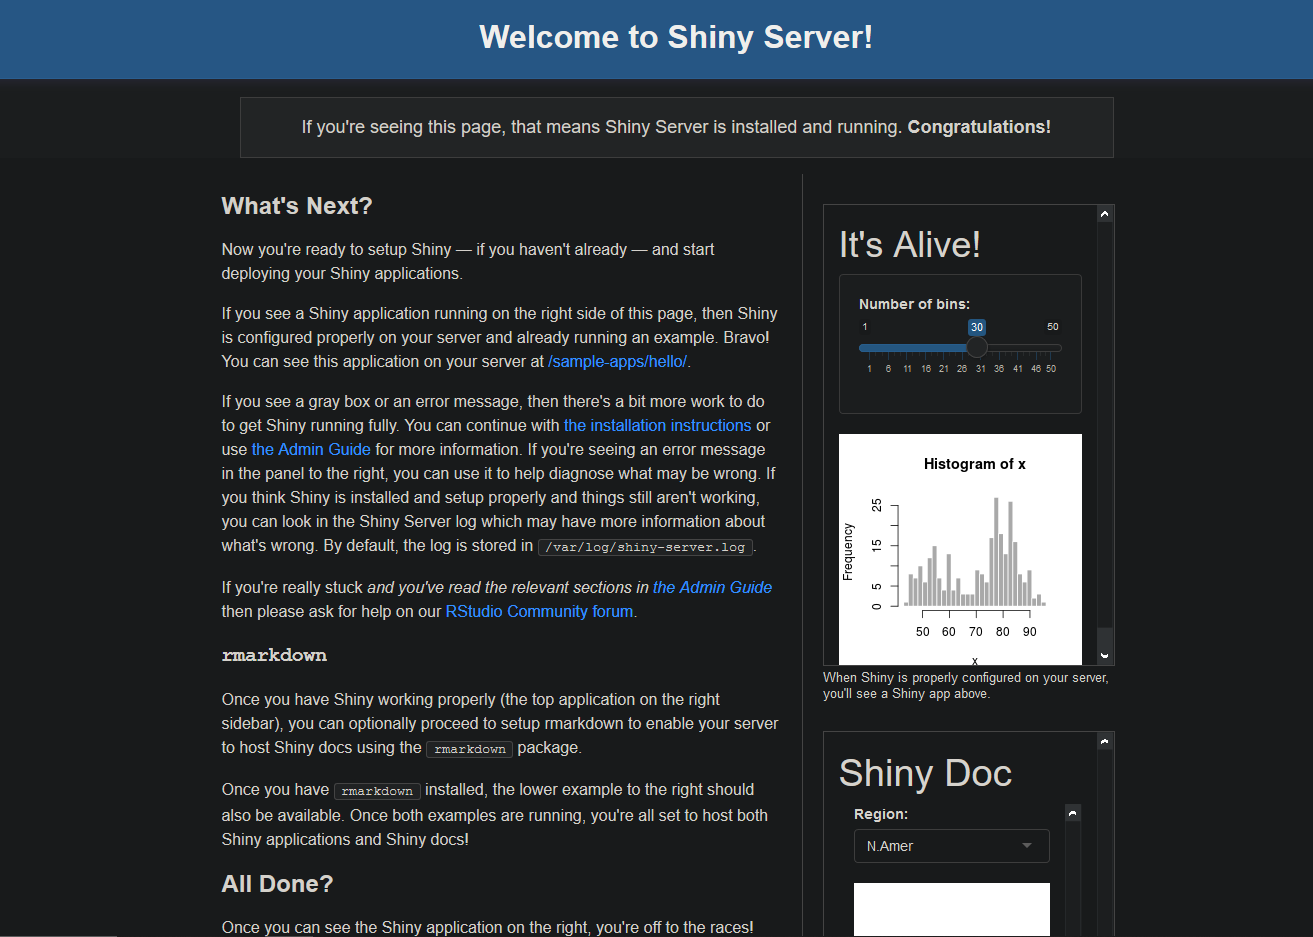
$ sudo su - -c "R -e \"install.packages('rmarkdown', repos='http://cran.rstudio.com/')\""ブラウザから[< localhost:3838 >] にアクセスして以下のような画面になればOK!
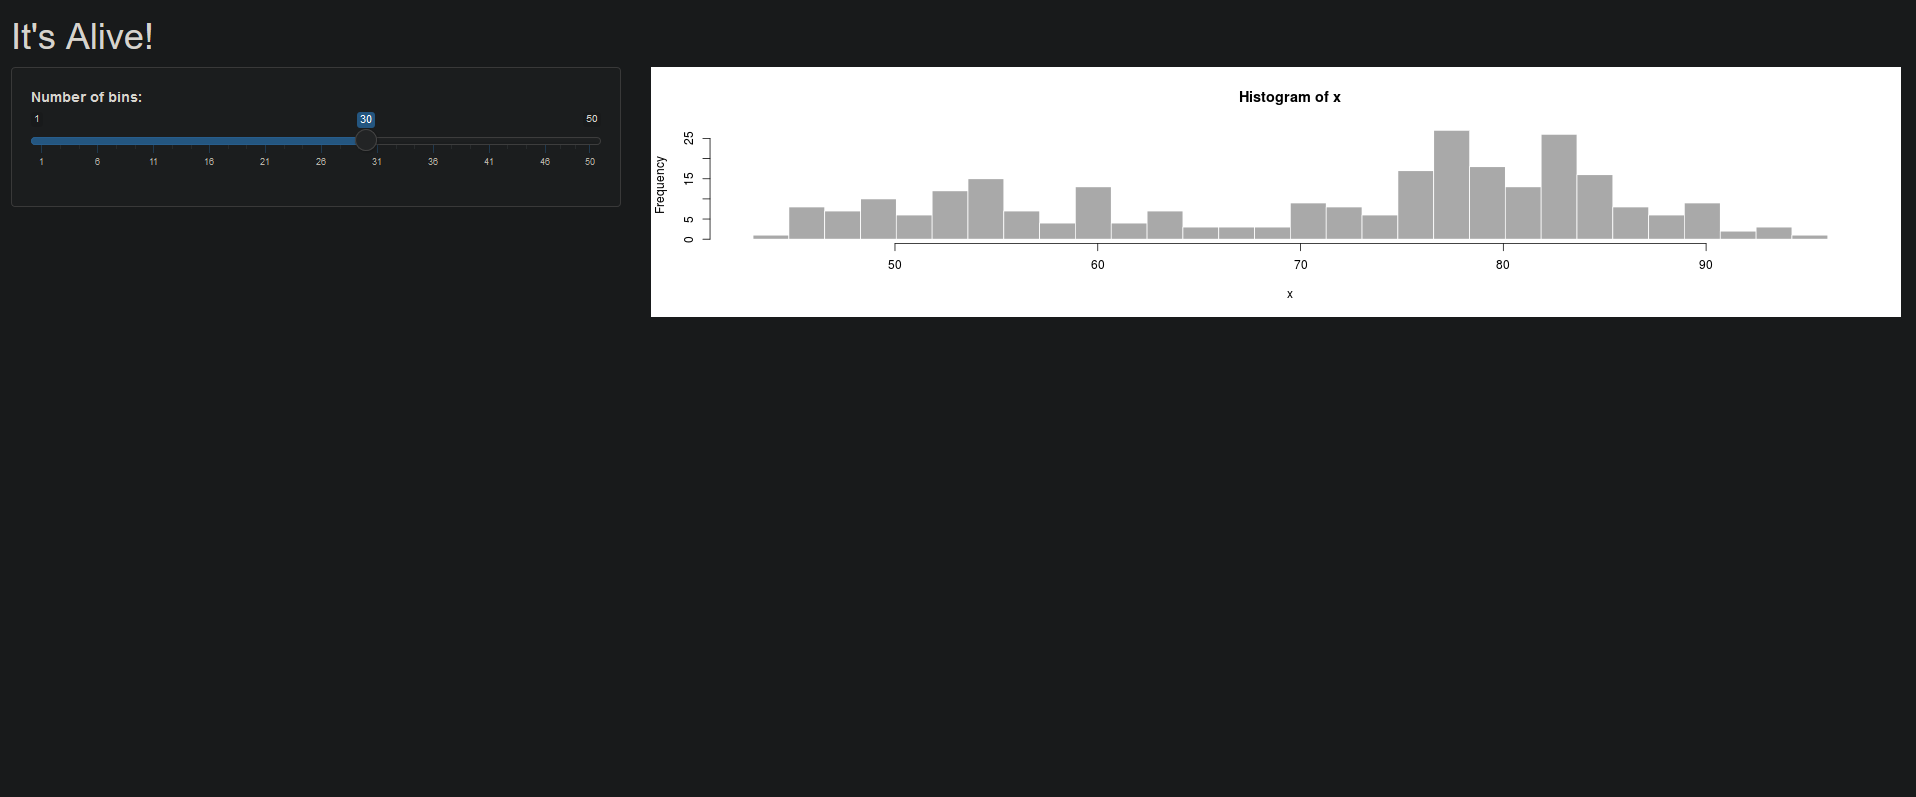
サンプルを見てみます。localhost:3838/sample-apps/hello をブラウザから見てみると。
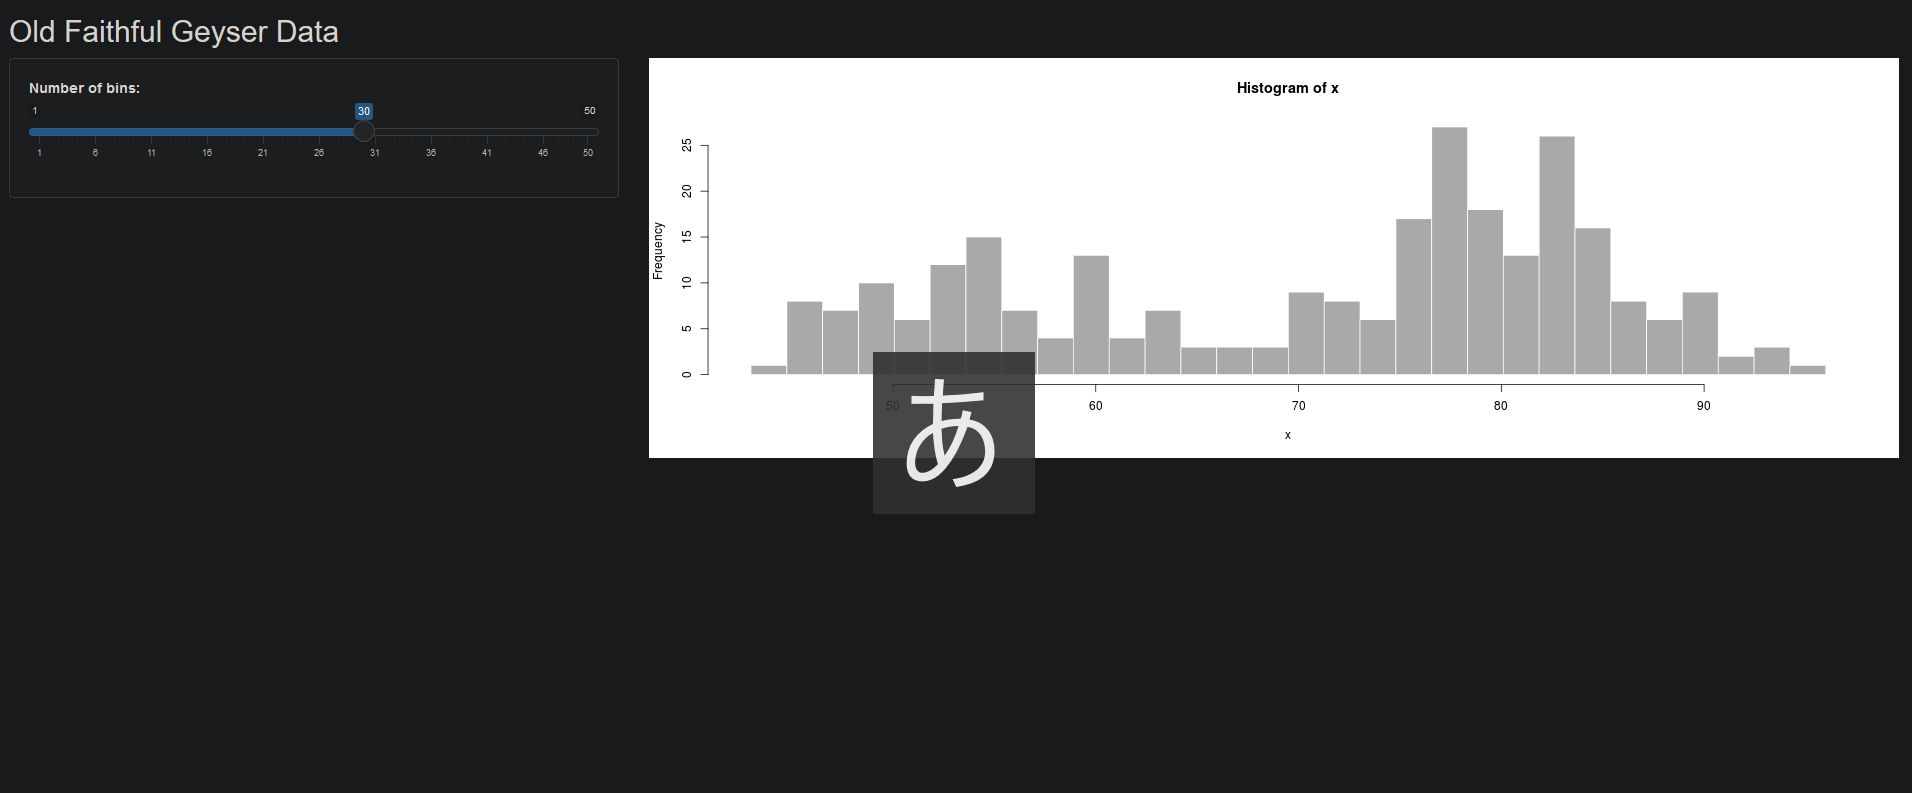
RStudioで作った /ShinyTest のサンプルを動かしてみます。RStudioで作成したデフォルトのShiny-appそのままです。
/srv/shiny-server/sample-apps 以下にサンプルのプロジェクトを移動させます。
server.R
#
# This is the server logic of a Shiny web application. You can run the
# application by clicking 'Run App' above.
#
# Find out more about building applications with Shiny here:
#
#    http://shiny.rstudio.com/
#

library(shiny)

# Define server logic required to draw a histogram
shinyServer(function(input, output) {

    output$distPlot <- renderPlot({

        # generate bins based on input$bins from ui.R
        x    <- faithful[, 2]
        bins <- seq(min(x), max(x), length.out = input$bins + 1)

        # draw the histogram with the specified number of bins
        hist(x, breaks = bins, col = 'darkgray', border = 'white')

    })

})
ui.R
#
# This is the user-interface definition of a Shiny web application. You can
# run the application by clicking 'Run App' above.
#
# Find out more about building applications with Shiny here:
#
#    http://shiny.rstudio.com/
#

library(shiny)

# Define UI for application that draws a histogram
shinyUI(fluidPage(

    # Application title
    titlePanel("Old Faithful Geyser Data"),

    # Sidebar with a slider input for number of bins
    sidebarLayout(
        sidebarPanel(
            sliderInput("bins",
                        "Number of bins:",
                        min = 1,
                        max = 50,
                        value = 30)
        ),

        # Show a plot of the generated distribution
        mainPanel(
            plotOutput("distPlot")
        )
    )
))
ブラウザから http://localhost:3838/sample-apps/ShinyTest/ にアクセスします。以下のように表示されれば成功です。