【R】稲城市をggplotで描画
2020年7月17日
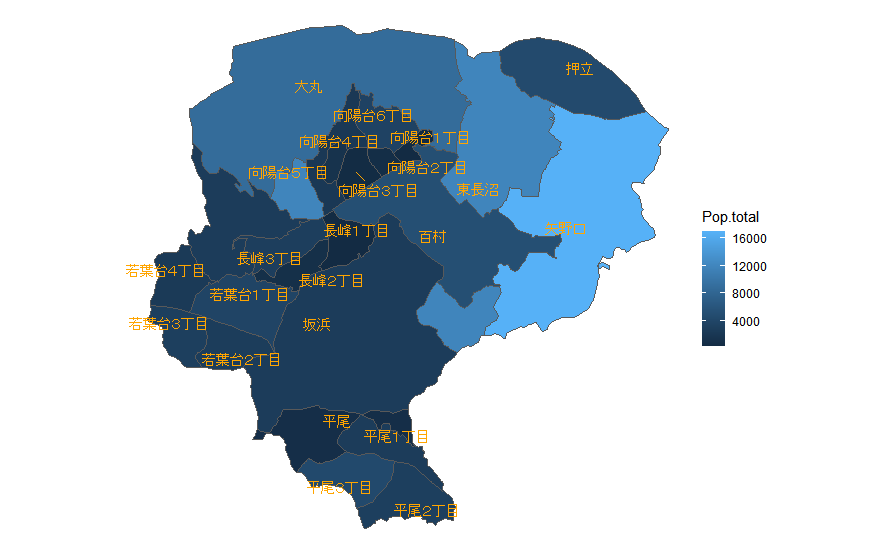
東京都稲城市を描画してみます。
library(ggplot2)
library(ggrepel)
library(sf)
library(dplyr)

map <- read_sf("shp/h27ka13225.shp") # 稲城市のシェープファイル

ggplot(map) + geom_sf()


map %>%
  group_by(S_NAME) %>% # 町名でグルーピング
  summarize('Pop.total' = sum(JINKO))  %>% # グループ単位で領域結合, 人口計算
  mutate( # 重心計算と座標値の抽出
    centroid = st_centroid(geometry),
    x = st_coordinates(centroid)[, 1],
    y = st_coordinates(centroid)[, 2]
  ) %>%
  ggplot() +
  geom_sf(aes(fill = Pop.total)) +  # 人口毎に色分け
  coord_sf(datum = NA) +
  theme_void()+
  geom_text_repel(aes(x = x, y = y, label = S_NAME), col = "orange",
                  family = "JP4", size = 4)