【R】山形県の人口別コロプレス図
2020年8月10日
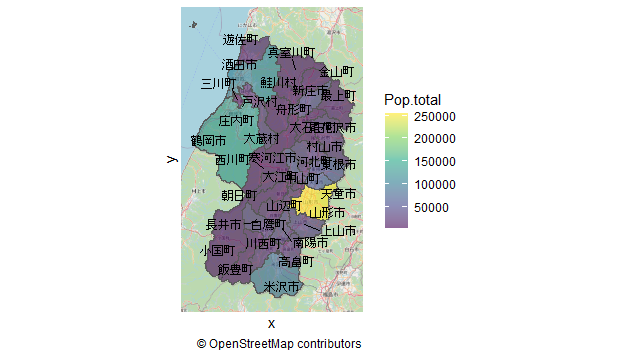
山形県の市区町村を人口別に塗りつぶしてみます。境界の描画は「地図で見る統計(統計GIS)」の「06000 山形県全域 世界測地系緯度経度・Shapefile」から取得します。
library(ggplot2)
library(ggrepel)
library(sf)
library(tidyverse)
library(kableExtra)
library(ggspatial)


map <- read_sf("shp/h27ka06.shp") # 山形県のシェープファイル


dat <- map %>%
  group_by(CITY_NAME) %>% # 市名でグルーピング
  summarize('Pop.total' = sum(JINKO))  %>% # グループ単位で領域結合, 人口計算
  mutate( # 重心計算と座標値の抽出
    centroid = st_centroid(geometry),
    x = st_coordinates(centroid)[, 1],
    y = st_coordinates(centroid)[, 2]
  ) %>%
  arrange(desc(Pop.total))

dat %>%
  ggplot() +
  annotation_map_tile(zoomin = 0) +
  geom_sf(aes(fill = Pop.total)) +  # 人口毎に色分け
  coord_sf(datum = NA) +
  scale_fill_viridis_c(alpha = 0.6) +
  theme_void()+
  geom_text_repel(aes(x = x, y = y, label = CITY_NAME), col="black",
                  family = "JP4", size = 3) +
  labs(caption = "\U00a9 OpenStreetMap contributors") +
  theme_minimal()


table_df<-data.frame(市区町村=dat$CITY_NAME, 人口=dat$Pop.total)

library(clipr)
table_df %>%
  kable(align = "c", row.names=FALSE) %>%
  kable_styling(full_width = F) %>%
  column_spec(1, bold = T) %>%
  collapse_rows(columns = 1, valign = "middle") %>%
  write_clip
| 市区町村 | 人口 |
|---|---|
| 山形市 | 253832 |
| 鶴岡市 | 129652 |
| 酒田市 | 106244 |
| 米沢市 | 85953 |
| 天童市 | 62194 |
| 東根市 | 47768 |
| 寒河江市 | 41256 |
| 新庄市 | 36894 |
| 南陽市 | 32285 |
| 上山市 | 31569 |
| 長井市 | 27757 |
| 村山市 | 24684 |
| 高畠町 | 23882 |
| 庄内町 | 21666 |
| 河北町 | 18952 |
| 尾花沢市 | 16953 |
| 川西町 | 15751 |
| 山辺町 | 14369 |
| 遊佐町 | 14207 |
| 白鷹町 | 14175 |
| 中山町 | 11363 |
| 最上町 | 8902 |
| 大江町 | 8472 |
| 真室川町 | 8137 |
| 小国町 | 7868 |
| 三川町 | 7728 |
| 大石田町 | 7357 |
| 飯豊町 | 7304 |
| 朝日町 | 7119 |
| 金山町 | 5829 |
| 西川町 | 5636 |
| 舟形町 | 5631 |
| 戸沢村 | 4773 |
| 鮭川村 | 4317 |
| 大蔵村 | 3412 |
