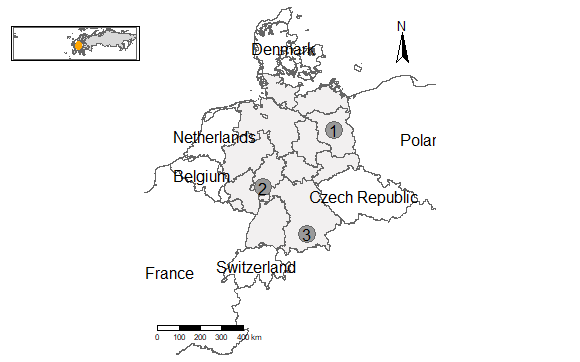
【R】周辺国を含めた地図
2020年11月29日
ある国に注目した地図を描くとき、その周辺の国々とインセット地図があればさらに理解が深まります。その方法です。
「Create a map of a country with the neighbouring countries and an inset map」を参考にさせていただきました。
library(tmap)   # to draw the map
library(tibble) # for sites table creation
library(sf)
library(maptools)
library(rgeos)
library(raster) # to download data

sites <- tribble(
  ~id, ~ Sites, ~ lat, ~ long,
  1, "Berlin", 52.5243700, 13.4105300,
  2, "Frankfurt", 50.110573, 8.684966,
  3, "Munich", 48.137154, 11.576124
)

sf_obj <- st_as_sf(sites, coords = c("long", "lat"), crs = 4326) # 4326: Geodetic coordinate system for World

# https://en.wikipedia.org/wiki/ISO_3166-1_alpha-3
germany <- getData("GADM", country = "DEU", level = 1)
denmark <- getData("GADM", country = "DNK", level = 0)
france <- getData("GADM", country = "FRA", level = 0)
switzerland <- getData("GADM", country = "CHE", level = 0)
austria <- getData("GADM", country = "AUS", level = 0)
poland <- getData("GADM", country = "POL", level = 0)
belgium <- getData("GADM", country = "BEL", level = 0)
czechia <- getData("GADM", country = "CZE", level = 0)
netherlands <- getData("GADM", country = "NLD", level = 0)
luxembourg <- getData("GADM", country = "LUX", level = 0)

# New bbox CI
bbox_deu <- st_bbox(germany) # current bounding box

xcrange <- bbox_deu$xmax - bbox_deu$xmin # range of x values
ycrange <- bbox_deu$ymax - bbox_deu$ymin # range of y values

bbox_deu[1] <- bbox_deu[1] - (0.5 * xcrange) # xmin - left
bbox_deu[3] <- bbox_deu[3] + (0.5 * xcrange) # xmax - right
bbox_deu[2] <- bbox_deu[2] - (0.5 * ycrange) # ymin - bottom
bbox_deu[4] <- bbox_deu[4] + (0.3 * ycrange) # ymax - top


bbox_deu <- bbox_deu %>%
  st_as_sfc()

eumap <- tm_shape(germany, bbox = bbox_deu) + # carte cote d'ivoire
  tm_polygons(col = "#f2f0f0") +
  tm_shape(sf_obj) +
  tm_symbols(size = 1.5) +
  tm_scale_bar(position = c("left", "bottom")) +
  tm_text("id") +
  tm_compass(position = c("right", "top")) +
  tm_layout(frame = FALSE) + # remove box around map
  tm_shape(france) + tm_polygons(col = "white") + tm_text("NAME_0") +
  tm_shape(switzerland) + tm_polygons(col = "white") + tm_text("NAME_0") +
  tm_shape(austria) + tm_polygons(col = "white") + tm_text("NAME_0") +
  tm_shape(netherlands) + tm_polygons(col = "white") + tm_text("NAME_0") +
  tm_shape(poland) + tm_polygons(col = "white") + tm_text("NAME_0") +
  tm_shape(czechia) + tm_polygons(col = "white") + tm_text("NAME_0") +
  tm_shape(belgium) + tm_polygons(col = "white") + tm_text("NAME_0") +
  tm_shape(denmark) + tm_polygons(col = "white") + tm_text("NAME_0")

data("wrld_simpl")
eu <- wrld_simpl[wrld_simpl$REGION==150,]

# extracting bounding box Abidjan
region <- st_as_sfc(st_bbox(eu))

all_eumap <- tm_shape(eu) + tm_polygons() +
  tm_shape(germany) + tm_dots(shape = 16, size = 0.1, col = "orange") +
  tm_shape(region) + tm_borders(lwd = .2)
all_eumap


eumap
print(all_eumap, vp = grid::viewport(0.13, 0.88, width = 0.23, height = 0.33))


