【R】ggmap
2020年12月1日
1. はじめに
ggmapもspatial dataで地図を描くパッケージです。geolocation や routingの機能も含んでいます。
2. インストール
CRANからインストールできます。
install.packages("ggmap")3. 使ってみる。
まずは、日本地図から。Stamenのサイトから取得したデータで地図を描きます。
library(ggmap)

ja <- c(left = 125, bottom = 25, right = 145, top = 55)
map <- get_stamenmap(ja, zoom = 6, maptype = "toner-lite")
ggmap(map)

次に、アメリカのダウンタウンの犯罪場所を表示。
downtown <- subset(crime,
                   -95.37681 <= lon & lon <= -95.32188 &
                     29.713631 <= lat & lat <=  29.76400
)

qmplot(lon, lat, data = downtown, maptype = "toner-background", color = I("red"))

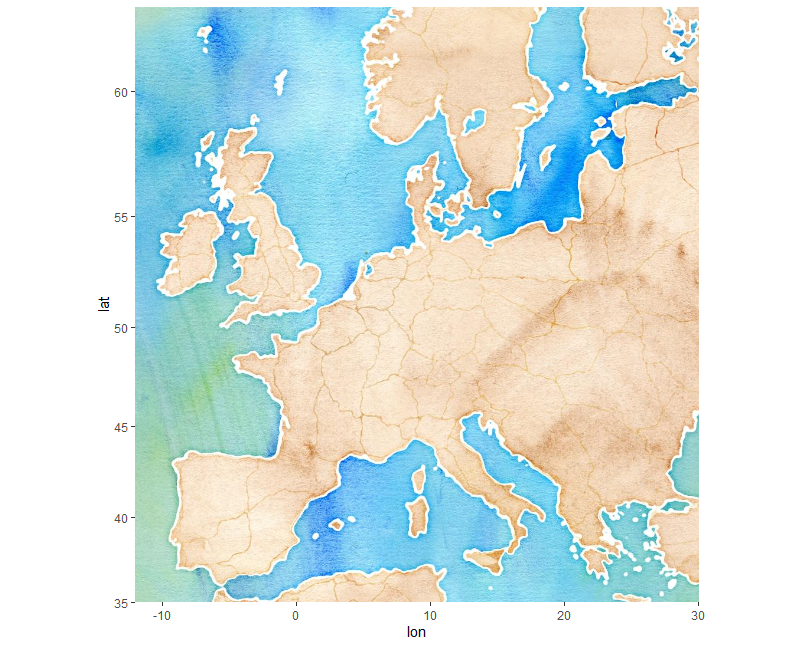
続いて、ヨーロッパをwatercolorにて。
europe <- c(left = -12, bottom = 35, right = 30, top = 63)
map <- get_stamenmap(europe, zoom = 5, maptype = "watercolor")
ggmap(map)

4. さいごに
地図は、GoogleマップやOpenStreetViewなども取得できます。
