【R】afrilearndata
2020年12月11日
1. はじめに
afrilearndataは、アフリカのデータをまとめたパッケージで、以下の6つのデータから構成されています。
africountriespolygons, country boundariesafricontinentpolygons, continent outline including madagascarafrihighwaylines, trans african highway networkafricapitalspoints, capital citiesafripop2020raster grid, population density 2020 from WorldPop aggregated to 20km squaresafripop2000raster grid, population density 2000 from WorldPop aggregated to 20km squares
これらのデータを可視化してみたいと思います。
2. インストール
インストールは、Githubで。
remotes::install_github("afrimapr/afrilearndata")3. つかってみる
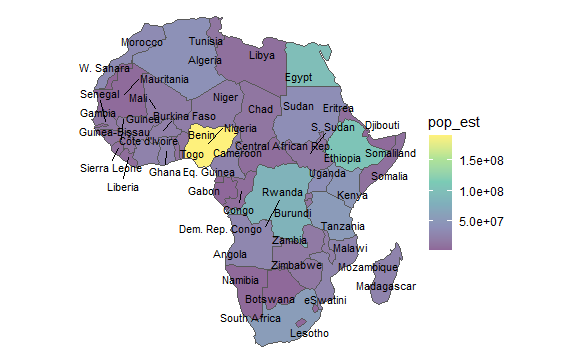
まずは、人工毎のコロプレス図を描きます。
library(afrilearndata)
library(ggplot2)
library(ggrepel)
library(sf)
library(tidyverse)
library(kableExtra)

dat <- africountries %>%
  mutate(
    centroid = st_centroid(geometry),
    x = st_coordinates(centroid)[, 1],
    y = st_coordinates(centroid)[, 2]
  ) %>%
  arrange(desc(pop_est))

dat %>%
  ggplot() +
  geom_sf(aes(fill = pop_est)) +
  coord_sf(datum = NA) +
  scale_fill_viridis_c(alpha = 0.6) +
  theme_void()+
  geom_text_repel(aes(x = x, y = y, label = name), col="black", size = 3)


table_df<-data.frame(Country=dat$name, Population=dat$pop_est)

library(clipr)
table_df %>%
  kable(align = "c", row.names=FALSE) %>%
  kable_styling(full_width = F) %>%
  column_spec(1, bold = T) %>%
  collapse_rows(columns = 1, valign = "middle") %>%
  write_clip
| Country | Population |
|---|---|
| Nigeria | 190632261 |
| Ethiopia | 105350020 |
| Egypt | 97041072 |
| Dem. Rep. Congo | 83301151 |
| South Africa | 54841552 |
| Tanzania | 53950935 |
| Kenya | 47615739 |
| Algeria | 40969443 |
| Uganda | 39570125 |
| Sudan | 37345935 |
| Morocco | 33986655 |
| Angola | 29310273 |
| Ghana | 27499924 |
| Mozambique | 26573706 |
| Madagascar | 25054161 |
| Cameroon | 24994885 |
| Cote d’Ivoire | 24184810 |
| Burkina Faso | 20107509 |
| Niger | 19245344 |
| Malawi | 19196246 |
| Mali | 17885245 |
| Zambia | 15972000 |
| Senegal | 14668522 |
| Zimbabwe | 13805084 |
| S. Sudan | 13026129 |
| Guinea | 12413867 |
| Chad | 12075985 |
| Rwanda | 11901484 |
| Burundi | 11466756 |
| Tunisia | 11403800 |
| Benin | 11038805 |
| Togo | 7965055 |
| Somalia | 7531386 |
| Libya | 6653210 |
| Sierra Leone | 6163195 |
| Eritrea | 5918919 |
| Central African Rep. | 5625118 |
| Congo | 4954674 |
| Liberia | 4689021 |
| Mauritania | 3758571 |
| Somaliland | 3500000 |
| Namibia | 2484780 |
| Botswana | 2214858 |
| Gambia | 2051363 |
| Lesotho | 1958042 |
| Guinea-Bissau | 1792338 |
| Gabon | 1772255 |
| eSwatini | 1467152 |
| Djibouti | 865267 |
| Eq. Guinea | 778358 |
| W. Sahara | 603253 |
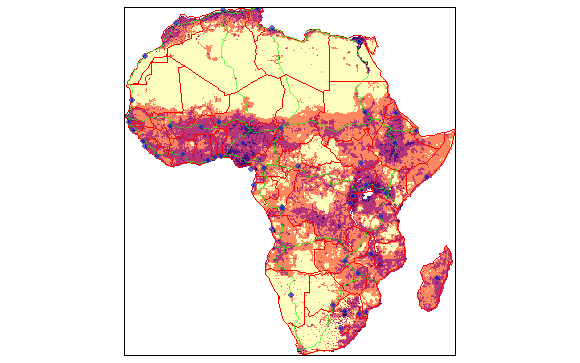
例にあるように、すべてのデータを使ってtmapで表現。
library(tmap)

tm_shape(afripop2020) +
  tm_raster(palette = rev(viridisLite::magma(5)), breaks=c(0,2,20,200,2000,25000)) +
  tm_shape(africountries) +
  tm_borders("red", lwd = .7) +
  tm_shape(afrihighway) +
  tm_lines(col = "green", alpha=0.6) +
  tm_shape(africapitals) +
  tm_symbols(col = "blue", alpha=0.6, scale = .4 )+
  tm_legend(show = FALSE)
4. さいごに
こうやって、データをまとめてくれると非常に使いやすいです(笑)。恥ずかしながら不勉強でアフリカのことをよく知らないのですが、これを機に勉強してみたいと思います。
