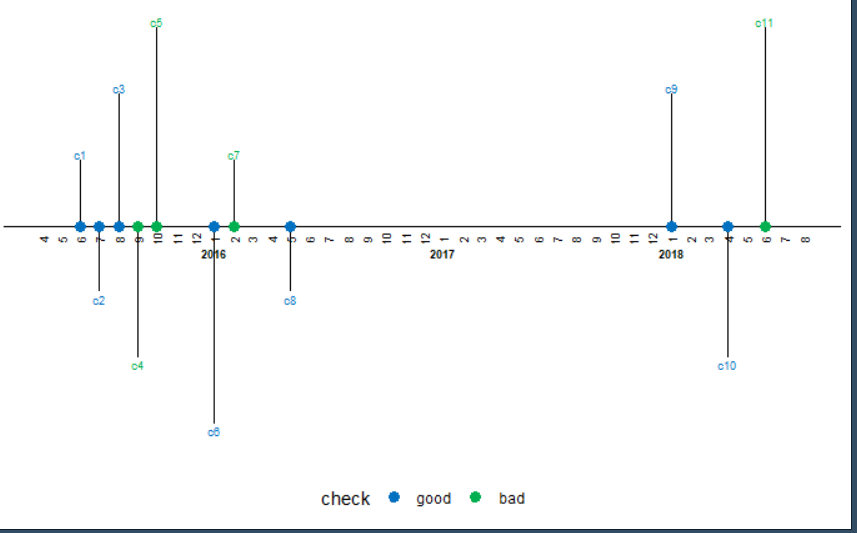
【R】time line plot
2021年3月25日
備忘録的に。こちらのページを参考にさせてもらいました。
library(ggplot2)
library(scales)
library(lubridate)

df <-data.frame(
  month=c(6,7,8,9,10,1,2,5,1,4,6),
  year=c(2015,2015,2015,2015,2015,2016,2016,2016,2018,2018,2018),
  check=c("c1","c2","c3","c4","c5","c6","c7","c8","c9","c10","c11"),
  eval=c("good","good","good","bad","bad","good","bad","good","good","good","bad")
  )

df$date <- with(df, ymd(sprintf('%04d%02d%02d', year, month, 1)))
df <- df[with(df, order(date)), ]
head(df)

status_levels <- c("good", "bad")
status_colors <- c("#0070C0", "#00B050")

df$status <- factor(df$eval, levels=status_levels, ordered=TRUE)


positions <- c(0.5, -0.5, 1.0, -1.0, 1.5, -1.5)
directions <- c(1, -1)

line_pos <- data.frame(
  "date"=unique(df$date),
  "position"=rep(positions, length.out=length(unique(df$date))),
  "direction"=rep(directions, length.out=length(unique(df$date)))
)

df <- merge(x=df, y=line_pos, by="date", all = TRUE)
df <- df[with(df, order(date, status)), ]

head(df)

text_offset <- 0.05

df$month_count <- ave(df$date==df$date, df$date, FUN=cumsum)
df$text_position <- (df$month_count * text_offset * df$direction) + df$position
head(df)

month_buffer <- 2

month_date_range <- seq(min(df$date) - months(month_buffer), max(df$date) + months(month_buffer), by='month')
month_format <- format(month_date_range, '%b')
month_df <- data.frame(month_date_range, month_format)


year_date_range <- seq(min(df$date) - months(month_buffer), max(df$date) + months(month_buffer), by='year')
year_date_range <- as.Date(
  intersect(
    ceiling_date(year_date_range, unit="year"),
    floor_date(year_date_range, unit="year")
  ),  origin = "1970-01-01"
)
year_format <- format(year_date_range, '%Y')
year_df <- data.frame(year_date_range, year_format)


### PLOT ####

timeline_plot<-ggplot(df,aes(x=date,y=0, col=status, label=check))
timeline_plot<-timeline_plot+labs(col="check")
timeline_plot<-timeline_plot+scale_color_manual(values=status_colors, labels=status_levels, drop = FALSE)
timeline_plot<-timeline_plot+theme_classic()

# Plot horizontal black line for timeline
timeline_plot<-timeline_plot+geom_hline(yintercept=0,
                                        color = "black", size=0.3)

# Plot vertical segment lines for milestones
timeline_plot<-timeline_plot+geom_segment(data=df[df$month_count == 1,], aes(y=position,yend=0,xend=date), color='black', size=0.2)

# Plot scatter points at zero and date
timeline_plot<-timeline_plot+geom_point(aes(y=0), size=3)

# Don't show axes, appropriately position legend
timeline_plot<-timeline_plot+theme(axis.line.y=element_blank(),
                                   axis.text.y=element_blank(),
                                   axis.title.x=element_blank(),
                                   axis.title.y=element_blank(),
                                   axis.ticks.y=element_blank(),
                                   axis.text.x =element_blank(),
                                   axis.ticks.x =element_blank(),
                                   axis.line.x =element_blank(),
                                   legend.position = "bottom"
)

# Show text for each month
timeline_plot<-timeline_plot+geom_text(data=month_df, aes(x=month_date_range,y=-0.1,label=month_format),size=2.5,vjust=0.5, color='black', angle=90)
# Show year text
timeline_plot<-timeline_plot+geom_text(data=year_df, aes(x=year_date_range,y=-0.2,label=year_format, fontface="bold"),size=2.5, color='black')
# Show text for each milestone
timeline_plot<-timeline_plot+geom_text(aes(y=text_position,label=check),size=2.5)
print(timeline_plot)