【R】LexisPlotR
2021年4月8日
1. はじめに
LexisPlotRは、レキシスによって発明された人口現象を表現するレキシスダイアグラムを描画してくれるパッケージです。ggplot2のWrapperですので、使い勝手がよさそうです。
2. インストール
CRANからインストールできます。
install.packages("LexisPlotR")3. つかってみる
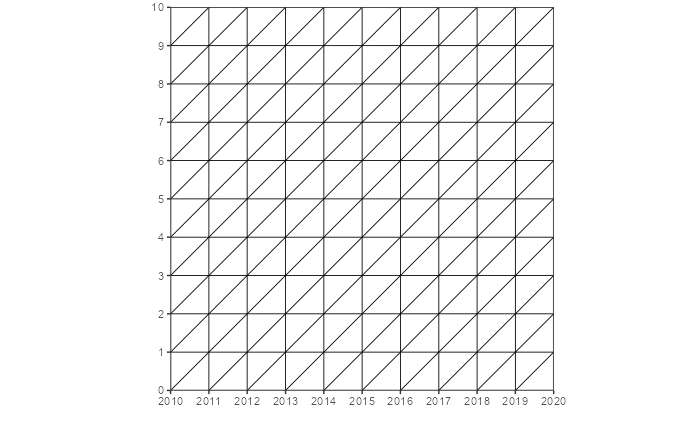
まずは簡単な2010年から2020年のレキシスダイアグラムを書いてみます。
library(LexisPlotR)

lexis_grid(year_start = 2010, year_end = 2020, age_start = 0, age_end = 10)
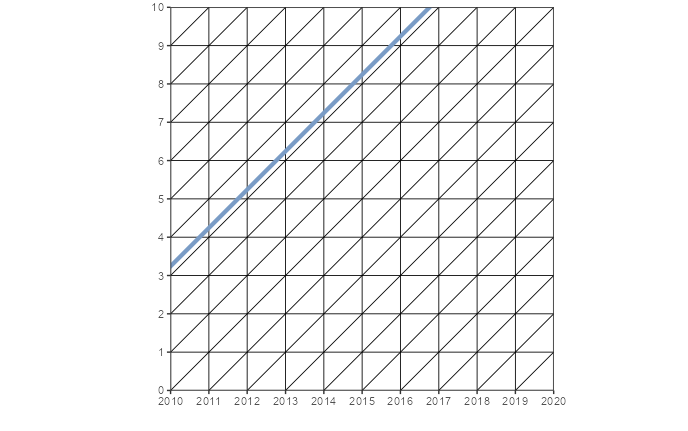
2006年10月5日生まれの人の生命線を書いてみます。
lg <- lexis_grid(year_start = 2010, year_end = 2020, age_start = 0, age_end = 10)
lexis_lifeline(lg = lg, birth = "2006-10-05", lwd = 1.5)
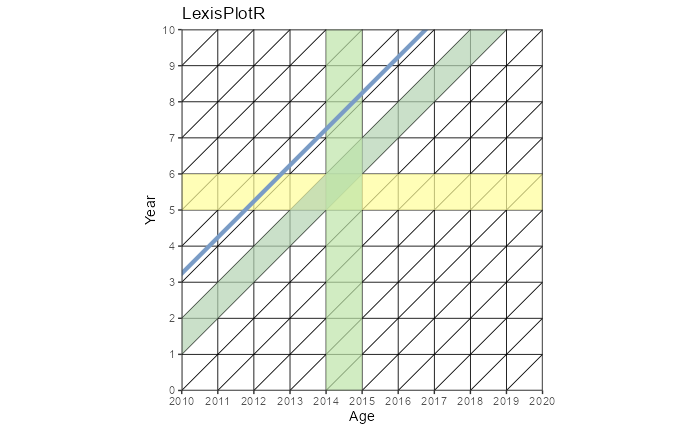
ggplot2のWrapperですので、同様の使い方ができます。
library(tidyverse)
library(ggplot2)

p <- lexis_grid(year_start = 2010, year_end = 2020, age_start = 0, age_end = 10) %>%
  lexis_age(age = 5) %>%
  lexis_cohort(cohort = 2008) %>%
  lexis_year(year = 2014) %>%
  lexis_lifeline(birth = "2006-10-05", lwd = 1.5)

p <- p + labs(x = "Age", y = "Year", "title" = "LexisPlotR")
p
4. さいごに
レキシスダイアグラムを初めて知りました。。。
