【R】openair
2021年4月10日
1. はじめに
openairは、大気に関するデータを解析するために作られました。the UK Natural Environment Research Council (NERC),の基金で元々は開発が始まったようです。最新の情報は、こちらの本にあります。
2. インストール
CRANからインストールできます。
install.packages("openair")3. つかってみる
the UK Automatic Urban and Rural Networkからデータを取得できます。
library(openair)
kc1 <- importAURN(site = "kc1", year = 2011:2012)
head(kc1)
> head(kc1)
# A tibble: 6 x 18
  site      code  date                   co   nox   no2    no    o3   so2  pm10 pm2.5
  <chr>     <fct> <dttm>              <dbl> <dbl> <dbl> <dbl> <dbl> <dbl> <dbl> <dbl>
1 London N~ KC1   2011-01-01 00:00:00   0.2    44    38     4    14     5    40    39
2 London N~ KC1   2011-01-01 01:00:00   0.2    38    29     6    28     3    36    30
3 London N~ KC1   2011-01-01 02:00:00   0.2    32    31     1    18     3    31    31
4 London N~ KC1   2011-01-01 03:00:00   0.2    31    29     1    14     3    31    29
5 London N~ KC1   2011-01-01 04:00:00   0.2    31    29     1    16     3    29    25
6 London N~ KC1   2011-01-01 05:00:00   0.1    29    27     1    24     3    25    23
# ... with 7 more variables: v10 <dbl>, v2.5 <dbl>, nv10 <dbl>, nv2.5 <dbl>,
# ws <dbl>, wd <dbl>, air_temp <dbl>Yorkの2015年のデータをAir Quality Englandから取得してみます。
yk13 <- importAQE(site = "yk13", year = 2015)
> yk13
# A tibble: 8,760 x 6
site code date nox no2 no
<chr> <fct> <dttm> <dbl> <dbl> <dbl>
1 York Heworth Green YK13 2015-01-01 00:00:00 NA NA NA
2 York Heworth Green YK13 2015-01-01 01:00:00 NA NA NA
3 York Heworth Green YK13 2015-01-01 02:00:00 NA NA NA
4 York Heworth Green YK13 2015-01-01 03:00:00 NA NA NA
5 York Heworth Green YK13 2015-01-01 04:00:00 NA NA NA
6 York Heworth Green YK13 2015-01-01 05:00:00 NA NA NA
7 York Heworth Green YK13 2015-01-01 06:00:00 NA NA NA
8 York Heworth Green YK13 2015-01-01 07:00:00 NA NA NA
9 York Heworth Green YK13 2015-01-01 08:00:00 NA NA NA
10 York Heworth Green YK13 2015-01-01 09:00:00 NA NA NA
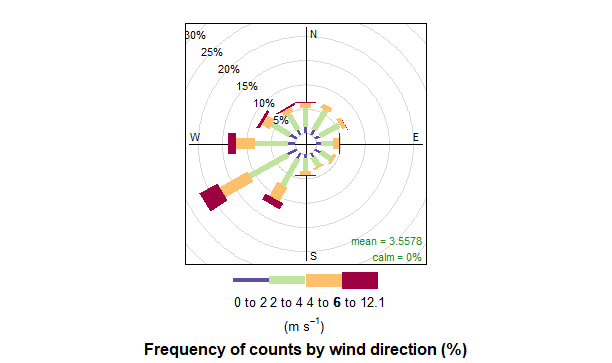
# ... with 8,750 more rows風向を簡単にグラフ表示できます。AURNから2015年のデータを取得して表示してみます。
aq_2015 <- importAURN(site = "kc1", year = 2015)
windRose(aq_2015)
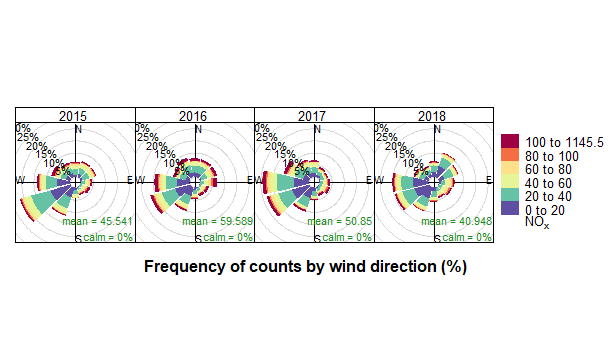
2015年から2018年のnoxのデータをグラフ表示してみます。
aq_2015_2018 <- importAURN(site = "kc1", year = c(2015:2018))
pollutionRose(aq_2015_2018, pollutant = "nox", type="year", layout = c(4, 1))
4. さいごに
しっかりお金が入っているだけに、とっても使いやすいパッケージだと思います。
