【R】ggsci
2021年4月21日
1. はじめに
ggsciは、様々なScientific journalにinspireされて作ったパレットです。
2. インストール
CRANからインストールできます。
install.packages("ggsci")3. つかってみる
まずは、例を実行してみます。
library("ggsci")
library("ggplot2")
library("gridExtra")

data("diamonds")

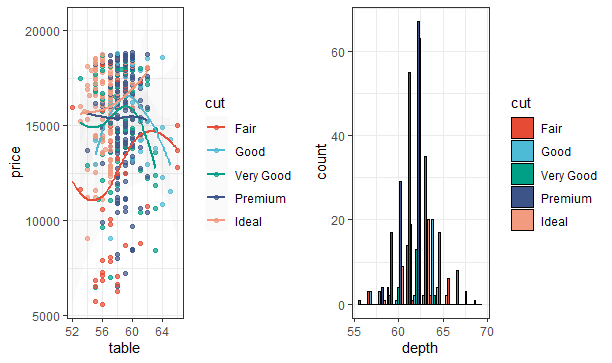
p1 <- ggplot(
  subset(diamonds, carat >= 2.2),
  aes(x = table, y = price, colour = cut)
) +
  geom_point(alpha = 0.7) +
  geom_smooth(method = "loess", alpha = 0.05, size = 1, span = 1) +
  theme_bw()

p2 <- ggplot(
  subset(diamonds, carat > 2.2 & depth > 55 & depth < 70),
  aes(x = depth, fill = cut)
) +
  geom_histogram(colour = "black", binwidth = 1, position = "dodge") +
  theme_bw()

p1_npg <- p1 + scale_color_npg()
p2_npg <- p2 + scale_fill_npg()
grid.arrange(p1_npg, p2_npg, ncol = 2)

ほほう、きれいですね。
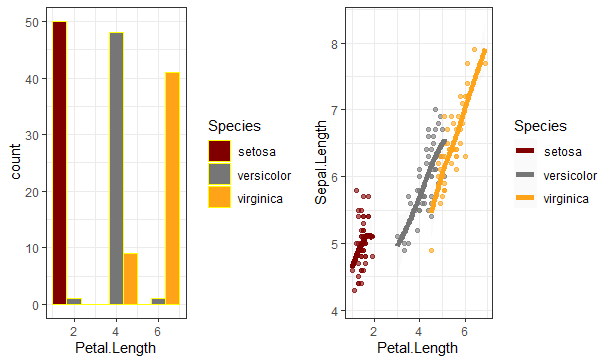
UChicagoっぽいもの
p3 <- ggplot(
  iris,
  aes(x = Petal.Length, fill = Species)
) +
  geom_histogram(colour = "yellow", binwidth = 2, position = "dodge") +
  theme_bw()

p4 <- ggplot(
  iris,
  aes(x = Petal.Length, y = Sepal.Length, colour = Species)
) +
  geom_point(alpha = 0.6) +
  geom_smooth(method = "loess", alpha = 0.05, size = 2, span = 1) +
  theme_bw()

p3_uchicago <- p3 + scale_fill_uchicago()
p4_uchicago <- p4 + scale_color_uchicago()
grid.arrange(p3_uchicago, p4_uchicago, ncol = 2)

4. さいごに
いろいろパレットが開発されていて表現力向上に役立ちそうです。
