【R】pyramidチャート
2021年6月23日
pyramidチャートの書き方を勉強したので、備忘録的に残します。こちらを参考にしました。
library(ggplot2)
library(plyr)
library(gridExtra)
## The Data
df <- data.frame(Type = sample(c('Male', 'Female', 'Female'), 1000, replace=TRUE),
Age = sample(18:60, 1000, replace=TRUE))
AgesFactor <- ordered(cut(df$Age, breaks = c(18,seq(20,60,5)),
include.lowest = TRUE))
df$Age <- AgesFactor
## Plotting
gg <- ggplot(data = df, aes(x=Age))
gg.male <- gg +
geom_bar( data=subset(df,Type == 'Male'),
aes( y = ..count../sum(..count..), fill = Age)) +
scale_y_continuous('', labels = scales::percent) +
theme(legend.position = 'none',
axis.title.y = element_blank(),
plot.title = element_text(size = 11.5),
plot.margin=unit(c(0.1,0.2,0.1,-.1),"cm"),
axis.ticks.y = element_blank(),
axis.text.y = theme_bw()$axis.text.y) +
ggtitle("Male") +
coord_flip()
gg.female <- gg +
geom_bar( data=subset(df,Type == 'Female'),
aes( y = ..count../sum(..count..), fill = Age)) +
scale_y_continuous('', labels = scales::percent,
trans = 'reverse') +
theme(legend.position = 'none',
axis.text.y = element_blank(),
axis.ticks.y = element_blank(),
plot.title = element_text(size = 11.5),
plot.margin=unit(c(0.1,0,0.1,0.05),"cm")) +
ggtitle("Female") +
coord_flip() +
ylab("Age")
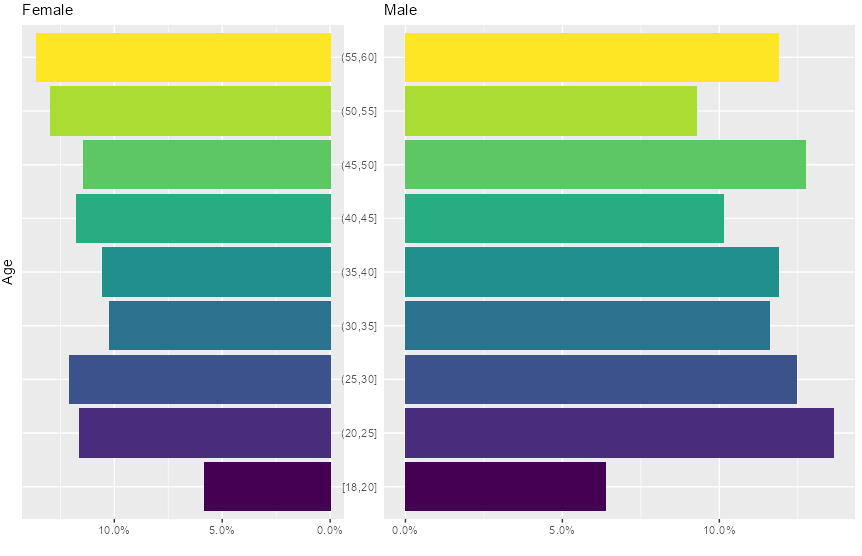
## Plutting it together
grid.arrange(gg.female,
gg.male,
widths=c(0.4,0.6),
ncol=2
)