【R】積み上げ棒グラフ
2021年6月27日
いつも忘れるので、備忘録的に。こちらのサイトを参照しました。
set.seed(85158) # Create example data
data <- data.frame(x = rep(LETTERS[1:5], each = 5),
y = round(runif(25, 10, 100)),
group = rep(LETTERS[6:10], time = 5))
head(data)
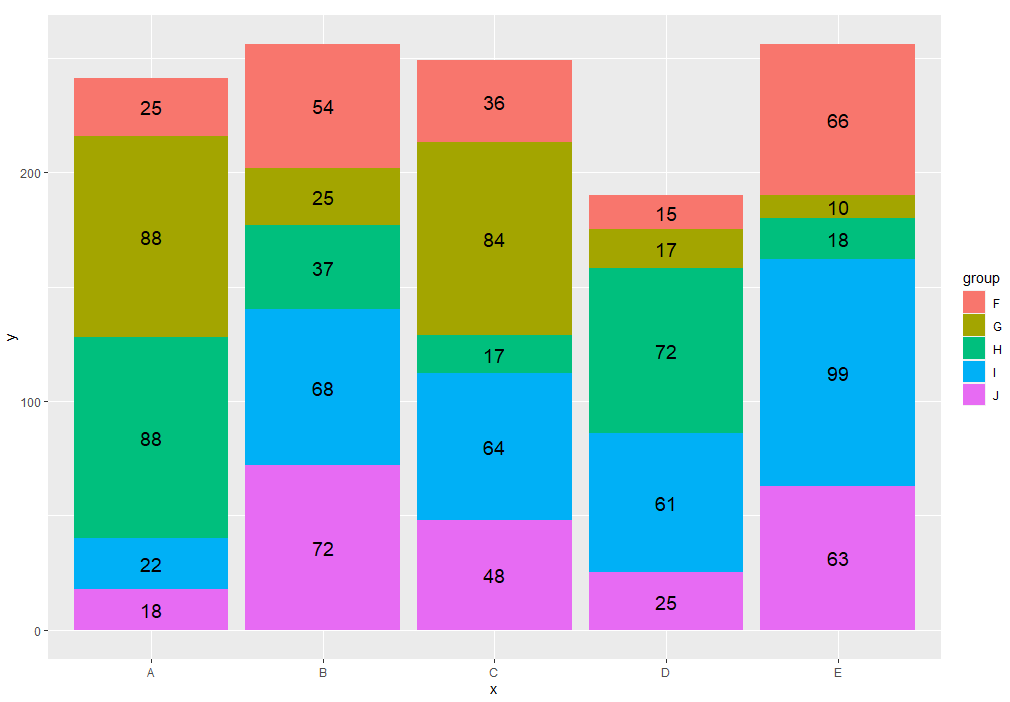
library(ggplot2)
ggp <- ggplot(data, aes(x = x, y = y, fill = group, label = y)) +
geom_bar(stat = "identity") +
geom_text(size = 5, position = position_stack(vjust = 0.5))
ggp