【R】terrainr
2021年9月10日
1. はじめに
terrainrは、National Map family of APIsにアクセスして米国各地の標高データ等を取得し、描画できるパッケージです。
2. インストール
CRANからインストールできます。
install.packages("terrainr")3. つかってみる
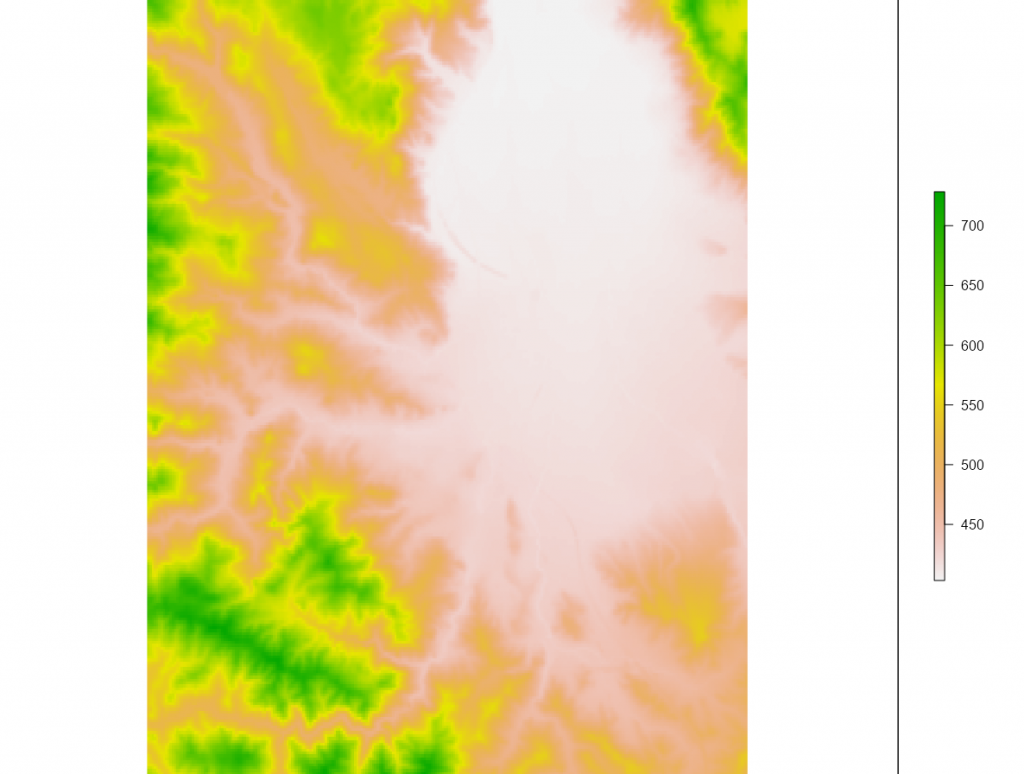
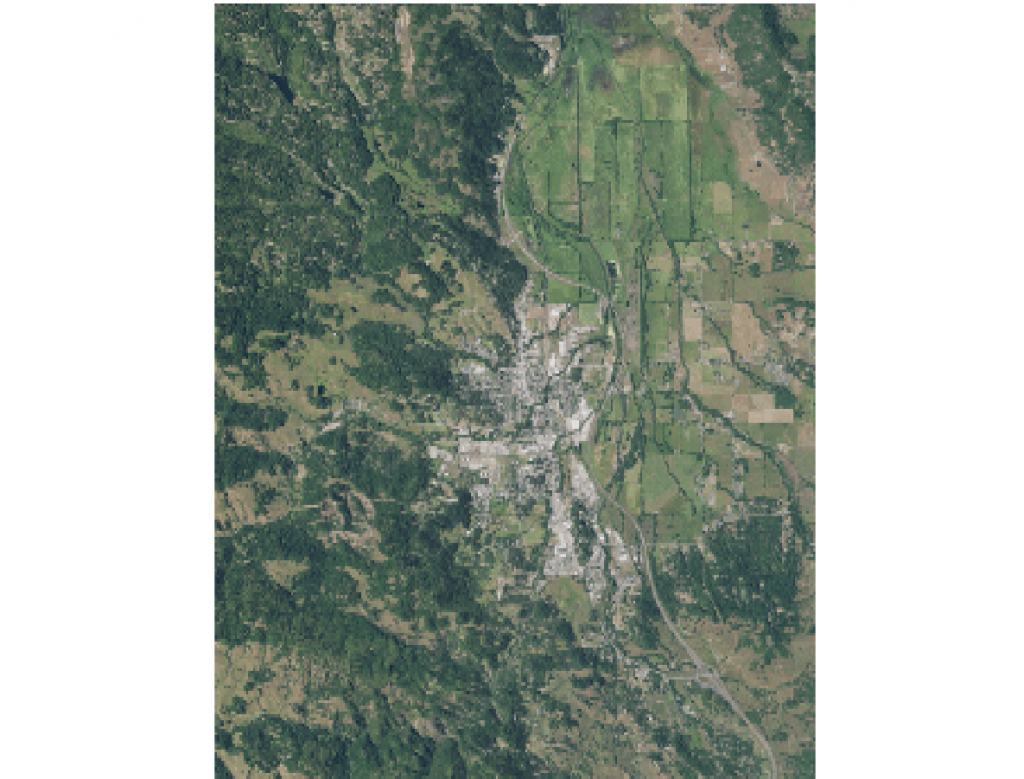
米国・カリフォルニア州・Willitsの地形を描画してみます。
library(terrainr)
library(sf)

library(progressr)
handlers("progress")
handlers(global = TRUE)

location_of_interest <- tmaptools::geocode_OSM("Willits California")$coords

location_of_interest <- data.frame(
  x = location_of_interest[["x"]],
  y = location_of_interest[["y"]]
)

location_of_interest <- st_as_sf(
  location_of_interest,
  coords = c("x", "y"),
  crs = 4326
)

location_of_interest <- set_bbox_side_length(location_of_interest, 8000)
output_tiles <- get_tiles(location_of_interest,
                          services = c("elevation", "ortho"),
                          resolution = 30 # pixel side length in meters
)

raster::plot(raster::raster(output_tiles[["elevation"]][[1]]))

raster::plotRGB(raster::brick(output_tiles[["ortho"]][[1]]), scale = 1)
raster::plotRGB(raster::brick(output_tiles[["ortho"]][[1]]), scale = 1)
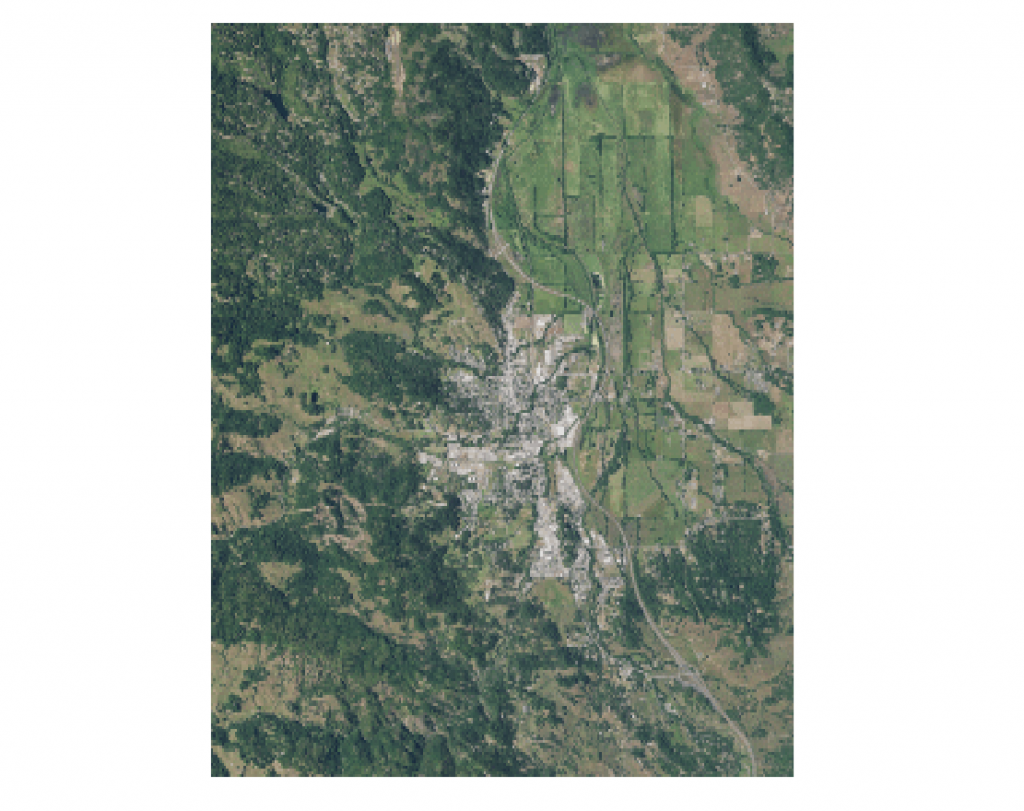
ggplotでも描けます。
library(ggplot2)
ggplot() +
  geom_spatial_rgb(data = output_tiles[["ortho"]],
                   aes(x = x, y = y, r = red, g = green, b = blue)) +
  coord_sf(crs = 4326) +
  theme_void()
4. さいごに
きれいな地形図を描けると気持ちいいですね。
