【R】都道府県別 そば収穫量
2020年1月27日
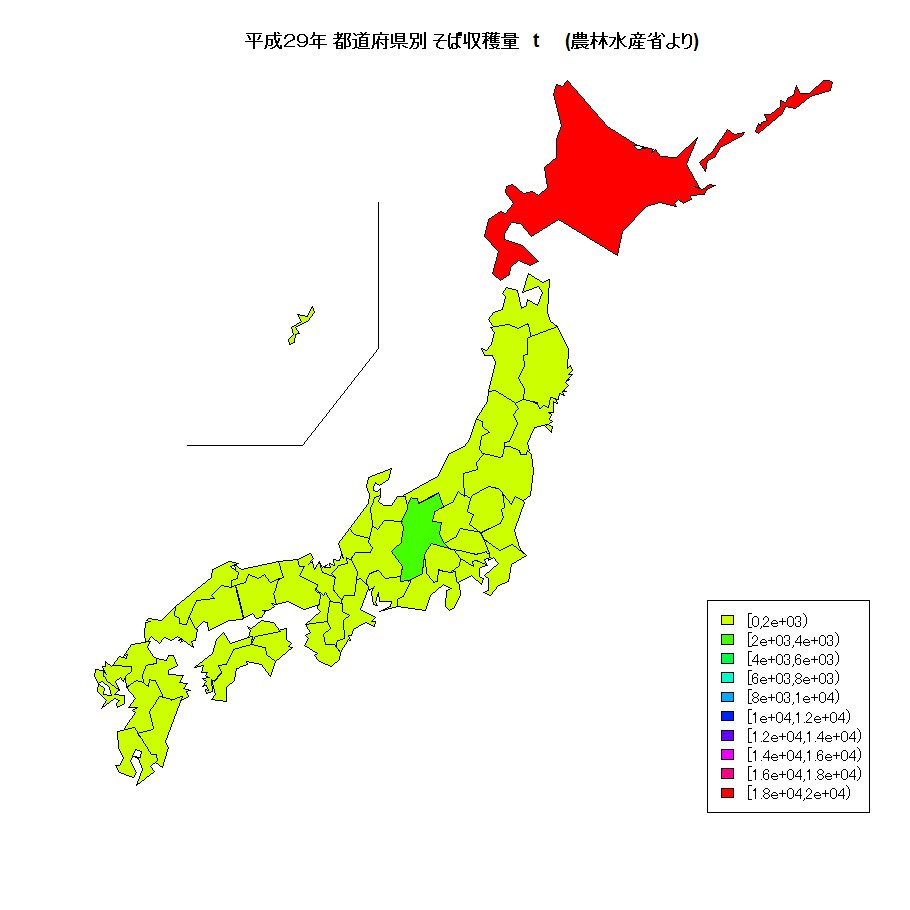
農林水産省が公表している 作物統計調査 から平成29年(2017年)都道府県別のそば収穫量を地図に描画します。収穫量が不明の都道府県は0にしています。
library(leaflet)
library(knitr)
library(kableExtra)
library(dplyr)
library(tidyr)
library(stringr)

dat <- read.csv("http://www.dinov.tokyo/Data/JP_Pref/Pref_data.csv", header = TRUE, fileEncoding="UTF-8")
col_start <- 0.2
col_end <- 0.0

table_df<-data.frame(都道府県=dat$都道府県, 出荷量t=dat$そば)
datc_m <- cut(dat$そば, hist(dat$そば, plot=FALSE)$breaks, right=FALSE)
datc_mcol <- rainbow(length(levels(datc_m)), start = col_start, end=col_end)[as.integer(datc_m)]

windowsFonts(JP4=windowsFont("Biz Gothic"))
windows(width=800, height=800)
par(family="JP4")

library(NipponMap)
JapanPrefMap(datc_mcol, main="平成29年 都道府県別 そば収穫量 t  (農林水産省より) ")
legend("bottomright", fill=rainbow(length(levels(datc_m)), start = col_start, end=col_end), legend=names(table(datc_m)))

kable(table_df, align = "c") %>%
  kable_styling(full_width = F) %>%
  column_spec(1, bold = T) %>%
  collapse_rows(columns = 1, valign = "middle")
| 都道府県 | 出荷量t |
|---|---|
| 北海道 | 18300 |
| 青森 | 483 |
| 岩手 | 774 |
| 宮城 | 86 |
| 秋田 | 1080 |
| 山形 | 1580 |
| 福島 | 1740 |
| 茨城 | 1770 |
| 栃木 | 1920 |
| 群馬 | 456 |
| 埼玉 | 222 |
| 千葉 | 60 |
| 東京 | 4 |
| 神奈川 | 5 |
| 新潟 | 483 |
| 富山 | 151 |
| 石川 | 84 |
| 福井 | 814 |
| 山梨 | 101 |
| 長野 | 2140 |
| 岐阜 | 95 |
| 静岡 | 28 |
| 愛知 | 12 |
| 三重 | 65 |
| 滋賀 | 224 |
| 京都 | 31 |
| 大阪 | 0 |
| 兵庫 | 82 |
| 奈良 | 8 |
| 和歌山 | 1 |
| 鳥取 | 87 |
| 島根 | 244 |
| 岡山 | 64 |
| 広島 | 92 |
| 山口 | 23 |
| 徳島 | 27 |
| 香川 | 8 |
| 愛媛 | 7 |
| 高知 | 2 |
| 福岡 | 26 |
| 佐賀 | 15 |
| 長崎 | 75 |
| 熊本 | 343 |
| 大分 | 81 |
| 宮崎 | 93 |
| 鹿児島 | 368 |
| 沖縄 | 31 |
北海道が圧倒的ですが、全国的に広く作られているようです。
出典:農林水産省 2017年 作物統計調査 平成29年産野菜生産出荷統計
