【R】因子分析
1.はじめに
あるデータをモデル化するときに、変数の数があまりに多い場合や変数の中に相互に相関の高いものが混じっている場合には、変数の数を減らす(次元を削減)する必要があります。このための手段としては、いくつかありますが、その一つが因子分析です。因子分析では、共通項をくくりだすことができます。
2.データ
ここでは、Rに含まれるmtcarsというデータを使用します。Rのドキュメントによると、Motor Trendという1974年のアメリカの車雑誌から、下記の11の変数に対して1973-1974年に発売された32種の車のデータを記載したものらしいです。
[, 1] 	mpg 	Miles/(US) gallon
[, 2] 	cyl 	Number of cylinders
[, 3] 	disp 	Displacement (cu.in.)
[, 4] 	hp 	Gross horsepower
[, 5] 	drat 	Rear axle ratio
[, 6] 	wt 	Weight (1000 lbs)
[, 7] 	qsec 	1/4 mile time
[, 8] 	vs 	Engine (0 = V-shaped, 1 = straight)
[, 9] 	am 	Transmission (0 = automatic, 1 = manual)
[,10] 	gear 	Number of forward gears
データの前半部分はこのようになっています。
> head(mtcars)
                   mpg cyl disp  hp drat    wt  qsec vs am gear carb
Mazda RX4         21.0   6  160 110 3.90 2.620 16.46  0  1    4    4
Mazda RX4 Wag     21.0   6  160 110 3.90 2.875 17.02  0  1    4    4
Datsun 710        22.8   4  108  93 3.85 2.320 18.61  1  1    4    1
Hornet 4 Drive    21.4   6  258 110 3.08 3.215 19.44  1  0    3    1
Hornet Sportabout 18.7   8  360 175 3.15 3.440 17.02  0  0    3    2
Valiant           18.1   6  225 105 2.76 3.460 20.22  1  0    3    1
3.因子数の決定
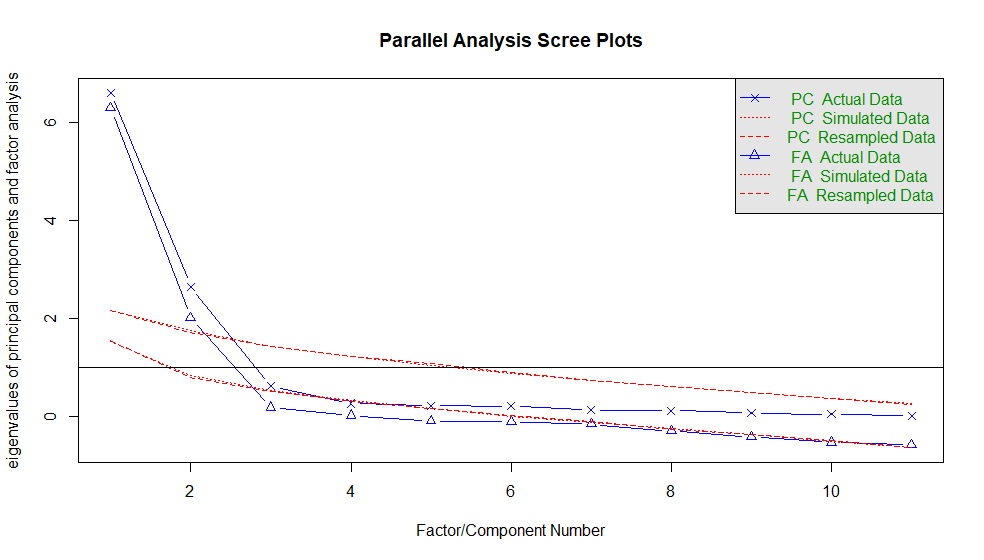
抽出する因子数を決定する方法の一つにスクリープロットの利用があります。これは、相関行列からその固有値を求めプロットします。固有値が1より小さくなる直前までを共通因子として採用するものです。
library(tidyverse)
library(psych)
library(ggplot2)

result.prl<-fa.parallel(mtcars, fm="ml")
自分で相関行列をcorにより求め、eigen(cor)$valuesから固有値を求め、それをplotしても良いのですが、psychパッケージにfa.parallelという関数があるのでこれを利用しました。実行結果は下記の通りです。この結果より、固有値が1以上であることから、因子数を2と決定します。

4.因子分析
因子分析は、factanal関数でできます。因子数2ですので、factor=2とします。また、回転はバリマックス回転とします。
ret<-factanal(mtcars, factors = 2, rotation = "varimax")
print(ret,  digit=3, cut=0, sort=TRUE)
Call:
factanal(x = mtcars, factors = 2, rotation = "varimax")

Uniquenesses:
  mpg   cyl  disp    hp  drat    wt  qsec    vs    am  gear  carb
0.167 0.070 0.096 0.143 0.298 0.168 0.150 0.256 0.171 0.246 0.386

Loadings:
     Factor1 Factor2
mpg   0.686  -0.602
disp -0.730   0.609
drat  0.807  -0.225
wt   -0.810   0.420
am    0.907   0.081
gear  0.860   0.125
cyl  -0.629   0.731
hp   -0.337   0.862
qsec -0.162  -0.908
vs    0.291  -0.812
carb  0.031   0.783

               Factor1 Factor2
SS loadings      4.494   4.357
Proportion Var   0.409   0.396
Cumulative Var   0.409   0.805

Test of the hypothesis that 2 factors are sufficient.
The chi square statistic is 68.57 on 34 degrees of freedom.
The p-value is 0.000405
このような結果になりました。
- uniquenesses(独自因子の分散)
- Loadings(因子負荷量)
観測変数に対して共通因子がどの程度影響を与えているか。 - SS loadings(因子寄与):各因子の2乗和
- Proportion Var(因子寄与率):因子寄与/項目数
その因子が全体分散のうちどの程度の割合を説明しているか。 - Cumulative Var(累積寄与率):因子寄与率を大きい順に積算。
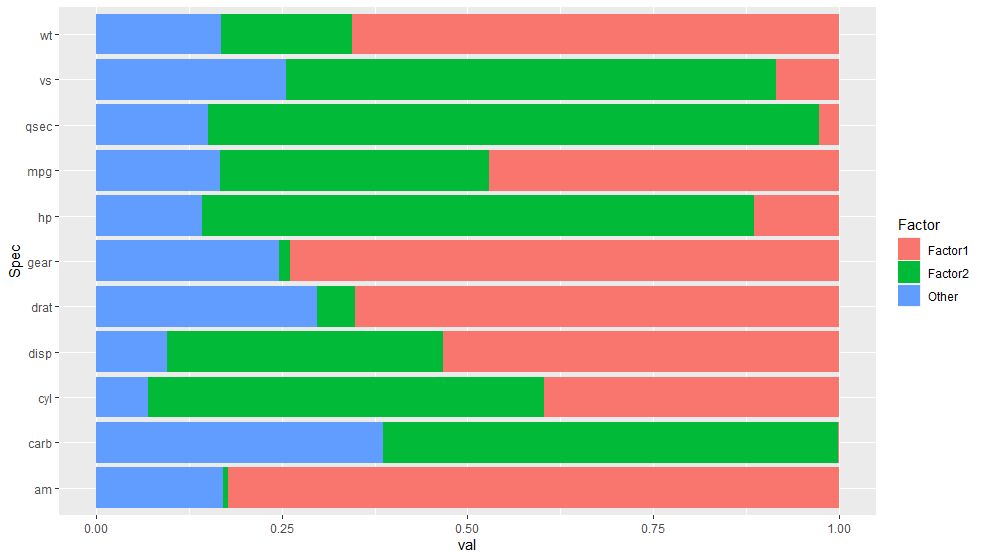
因子1Factor1>因子2Factor2となる[mpg, disp, drat, wt, am, gear]の組と、逆の[cyl, hp, qsec, vs, carb]に分けられそうです。この意味付けをすることが人間の役割ですが・・・。さて、それぞれの因子は何を表すのでしょうか?思いつきませんでした・・・。Cumulative Varより80.5%の説明ができているようです。この結果をグラフにしてみるとよりよくわかりそうです。
tf<-ret$loadings[c(1:11),c(1:2)] %>% as_tibble()
tf <- data.frame(c(colnames(mtcars)), tf[,1]^2, tf[,2]^2, 1-tf[,1]^2-tf[,2]^2)
colnames(tf)<-c("Spec", "Factor1", "Factor2", "Other")

tf_long<-tf %>% tibble::rowid_to_column("id") %>%
  pivot_longer(c(-id, -Spec), names_to = "f_name", values_to = "val")

ggplot(tf_long, aes(x=Spec, y=val, fill=f_name))+
  geom_bar(stat = "identity", position = "fill") +
  labs(fill="Factor") +
  coord_flip()

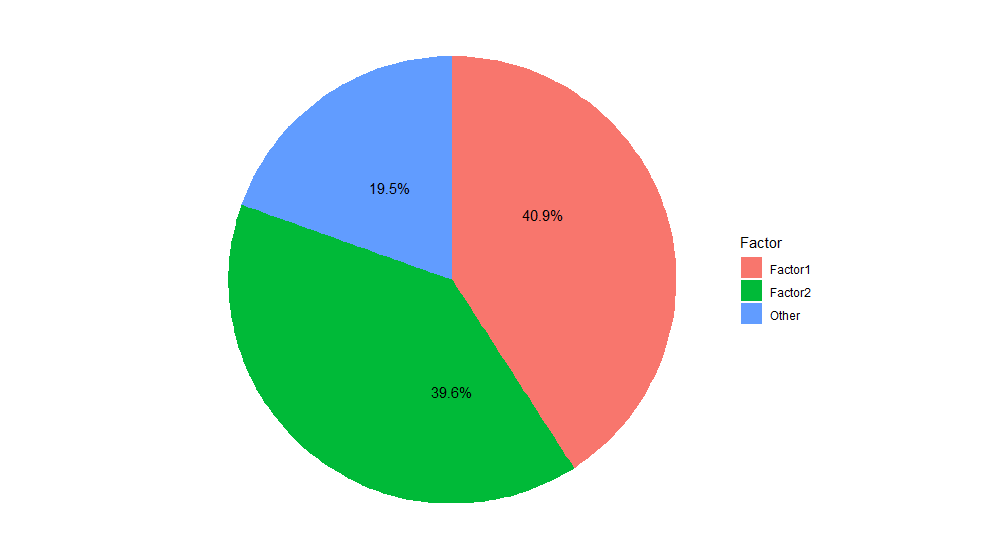
寄与率を円グラフにしてみます。どのFactorがどれだけ寄与しているかわかります。
# calculate the proportion var of "other"
fu<-unlist(ret)
# Calculate the proportion Variance of Fator1
prop_var1<-sum(ret$loadings[,1]^2)/nrow(ret$loadings)
# Calculate the proportion Variance of Fator2
prop_var2<-sum(ret$loadings[,2]^2)/nrow(ret$loadings)
# calculate the proportion var of "other"
prop_var_other<-1-prop_var1-prop_var2

prop_var<-data.frame("F_name"=c("Factor1", "Factor2", "Other"), "Val"=c(prop_var1, prop_var2, prop_var_other))

prop_var$label <- scales::percent(prop_var$Val)
ggplot(prop_var, aes(x="", y=Val, fill=F_name)) +
  geom_bar(stat="identity", width = 1)+
  coord_polar("y", start=0, direction = -1)+
  theme_void() +
  labs( fill = "Factor") +
  geom_text(aes(x=1, y = rev(cumsum(Val)-Val/1.3) , label=label))

5.結果まとめ
- スクリープロットより因子数は2
- 第一因子は
[mpg, disp, drat, wt, am, gear]が高い因子負荷量を示した。ており、第二因子は[cyl, hp, qsec, vs, carb]が高い因子負荷量を示した。意味の解釈まではできず・・・。 - 2因子で全体の分散の80.5%を説明できている。
