【R】flexdashboard
2020年6月17日
1.はじめに
Rで解析した結果等をダッシュボードで表示できると見やすくなりますよね。ダッシュボードを簡単に作れるパッケージがflexdashboardです。
2.インストール
CRANからインストールできます。
install.packages("flexdashboard")3.使ってみる
実際の使い方は簡単です。
「Building dashboards with flexdashboard and Shiny」こちらのページを見ると良くわかります。特に「Slides」は導入として分かりやすいです。
で、こんなコードを書いて実行してみます。
---
title: "Iris"
output:
  flexdashboard::flex_dashboard:
    orientation: rows
    vertical_layout: fill
date: "`r Sys.Date()`"
runitime: shiny
---

<style>
.navbar {
  background-color: #53e055;
  border-color: #53e055
}

.navbar-inverse .navbar-nav > li > a:hover,
.navbar-inverse .navbar-nav > li > a:focus {
    background-color: #ed8218;
    color: white;
}
.navbar-inverse .navbar-nav > .active > a,
.navbar-inverse .navbar-nav > .active > a:hover,
.navbar-inverse .navbar-nav > .active > a:focus {
  color: white;
  background-color: #ed8218;
}
.navbar-inverse .navbar-toggle:hover,
.navbar-inverse .navbar-toggle:focus {
  background-color: #ed8218;
}
.navbar-inverse .navbar-collapse,
.navbar-inverse .navbar-form {
  border-color: #ed8218;
}
</style>


```{r setup, include=FALSE}
library(flexdashboard)
library(knitr)
library(palmerpenguins)
library(shiny)
library(tidyverse)

penguins <- palmerpenguins::penguins

```

Analysis
=====================================

Row
-------------------------------------------------------------------------

### Iris measured

```{r n_iris}

n_iris <- nrow(iris)
valueBox(n_iris, icon = "fa-pencil", color = "#fa7404")

```

-------------------------------------------------------------------------

### Average sepal length

```{r sepal_length}

sepal_length <- paste0(round(mean(iris$Sepal.Length,
                                na.rm = TRUE)), " mm")
valueBox(sepal_length,
         icon = "fa-ruler", color = "#fa7404")

```

### Average sepal width

```{r sepal_width}

sepal_width <- paste0(round(mean(iris$Sepal.Width,
                                na.rm = TRUE)), " mm")
valueBox(sepal_width,
         icon = "fa-ruler", color = "#fa7404")

```

### Average petal length

```{r petal_length}

petal_length <- paste0(round(mean(iris$Petal.Length,
                                na.rm = TRUE)), " mm")
valueBox(petal_length,
         icon = "fa-ruler", color = "#fa7404")

```

### Average petal width

```{r petal_width}

petal_width <- paste0(round(mean(iris$Petal.Width,
                                na.rm = TRUE)), " mm")
valueBox(petal_width,
         icon = "fa-ruler", color = "#fa7404")

```


Row
-------------------------------------

### Sepal Length vs. Petal Length

```{r plot, echo = FALSE}

library(plotly)

length_plot <- ggplot(iris, aes(iris$Sepal.Length, iris$Petal.Length)) +
  geom_point(aes(color = Species), size = 3, alpha = 0.8) +
  theme_minimal() +
  scale_color_manual(values = c("darkorange","purple","cyan4")) +
  labs(x = "Sepal length [mm]",
       y = "Petal length [mm]",
       color = "Iris species")

ggplotly(length_plot)

```

Column
---------------------------------------
### Histogram of iris sepal width

```{r iris_sepal_hist, echo = FALSE}

ggplot(iris, aes(iris$Sepal.Width)) +
  geom_histogram(aes(fill = Species),
                 alpha = 0.5,
                 position = "identity") +
  scale_color_manual(values = c("darkorange","purple","cyan4")) +
  theme_minimal() +
  labs(x = "Sepal width [mm]",
       y = "Frequency",
       title = "Iris Sepal Width")

```

---------------------------------------
### Histogram of iris petal width

```{r iris_petal_hist, echo = FALSE}

ggplot(iris, aes(iris$Petal.Width)) +
  geom_histogram(aes(fill = Species),
                 alpha = 0.5,
                 position = "identity") +
  scale_color_manual(values = c("darkorange","purple","cyan4")) +
  theme_minimal() +
  labs(x = "Petal width [mm]",
       y = "Frequency",
       title = "Iris Petal Width")

```

```{r image}
knitr::include_graphics("culmen_depth.png")
```

Raw Data
=====================================

Row
-------------------------------------

### Data Table of Raw Data

```{r table}
DT::datatable(iris, options = list(
  pageLength = 25,
  height = "600px"
))
```

Row {data-height=100}
-------------------------------------

```{r download}

library(shiny)

fluidRow(
  downloadHandler(filename = function() {
    return("iris.csv")

 }, content = function(file) {
   write.csv(iris, file)
 })
)

```
すると、こんな風に表示されます。
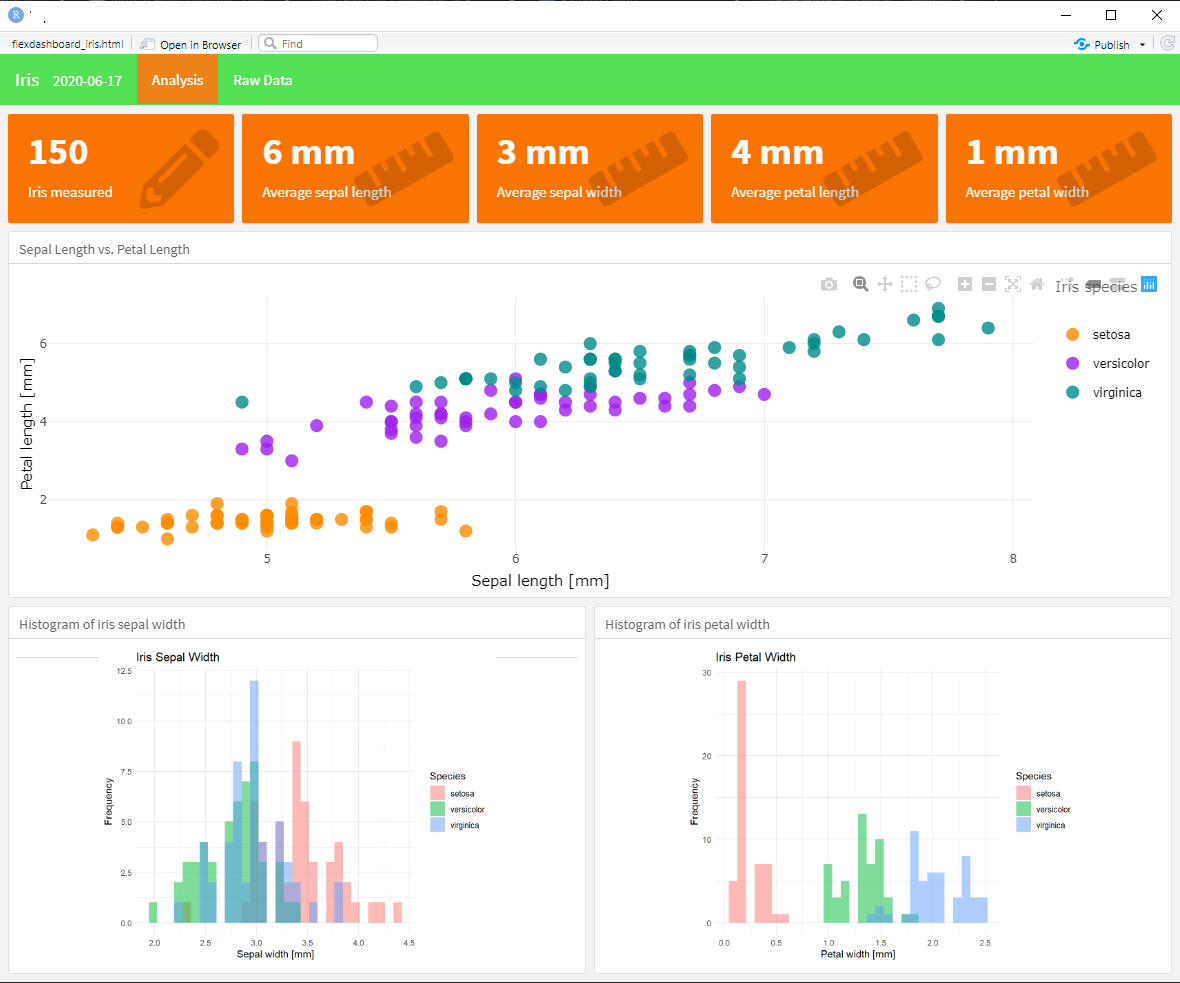

インタラクティブでユーザーフレンドリーなダッシュボードが利用できます。
GithubにDeployしたのはこちら。
実際に使ってみると実感できますが、flexdashboardとshinyの違いは次の通りです。
flexdashboard
・R Markdown
・Easy & intuitive
・Static or dynamic
・CSS flex layout
Shiny
・Shiny UI code
・Not very easy
・Always dynamic
・Bootstrap grid layout
4.さいごに
flexdashboardとshinyはそれぞれ一長一短ありそうですが、flexdashboardは柔軟性に欠けるかもしれませんが、簡単にR Markdownで記述できるところがいいですね。
