【R】県庁所在地のプロット
2020年7月17日
ふと思い立って、県庁所在地を地図上にプロットしてみることにしました。緯度・経度の情報は、「師匠の散歩」のページから使わせてもらいました。スクレイピングでテーブルデータから緯度・経度情報を取得しました。実際のプログラムは次の通りです。
library(tidyverse)
library(httr)
library(maps)
library(rvest)
library(leaflet)

response <- GET("http://tancro.e-central.tv/grandmaster/maps/capitalTable.html")
rawResponse <- content(response, "raw")
tableNodes <- read_html(rawResponse[rawResponse != 0]) %>% html_nodes("table")
tables <- html_table(tableNodes[1:1], fill=TRUE)

df <- tables[[1]]
colnames(df) <- (c("code", "pref_name", "pref_office_loc", "address", "lon", "lat", "V1", "V2", "V3", "V4", "V5", "V6"))

dat <- df %>%
  slice(-1) %>%
  select(code, pref_name, pref_office_loc, address, lon, lat) %>%
  mutate(lon = as.numeric(lon), lat=as.numeric(lat))

redLeafIcon <- makeIcon(
  iconUrl = "http://leafletjs.com/examples/custom-icons/leaf-red.png",
  iconWidth = 10, iconHeight = 20,
)

leaflet(dat) %>%
  addTiles() %>%
  addMarkers(dat$lon, dat$lat, popup = dat$pref_office_loc, icon = redLeafIcon)
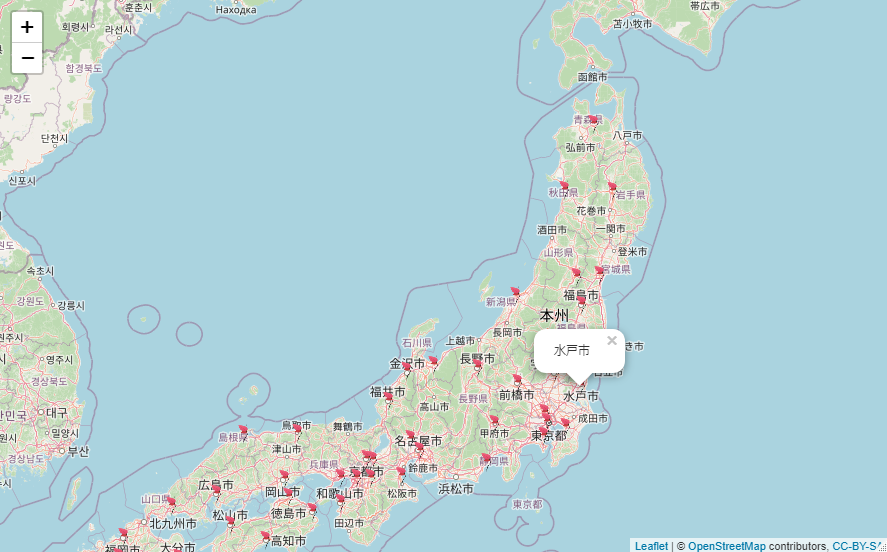
leafletでインタラクティブな地図が次のように表示されます。