【R】東京都 市区町村別 中学生数
2020年7月29日
東京都が公表している「くらしと統計」というデータより、市区町村別の中学生図をコロプレス図にて表示してみたいと思います。データは2017年とちょっと古いです。
統計データは、あらかじめ整理してCSVファイルとしておきました。これをダウンロードして利用します。市区町村のsfデータは、jpndistrictパッケージから使います。島しょ部は、カットさせていただきました。申し訳ありません。
コードはこんな感じ。
library(ggplot2)
library(ggrepel)
library(sf)
library(dplyr)

library(jpndistrict)

dat <- read.csv("http://www.dinov.tokyo/Data/JP_Pref/TokyoData.csv", header = TRUE, encoding = "UTF-8")

sf_pref13 <-
  jpn_pref(13, district = TRUE) %>%
  slice(c(1:53))  %>%
  mutate(
    centroid = st_centroid(geometry),
    x = st_coordinates(centroid)[, 1],
    y = st_coordinates(centroid)[, 2]
  ) %>%
  left_join(dat, by="city") %>%
  ggplot() +
  geom_sf(aes(fill = pop.jrhigh)) +
  coord_sf(datum = NA) +
  theme_void()+
  geom_text_repel(aes(x = x, y = y, label = city),
                  family = "JP4", size = 3, col="orange")

sf_pref13
コロプレス図はこんな感じ。
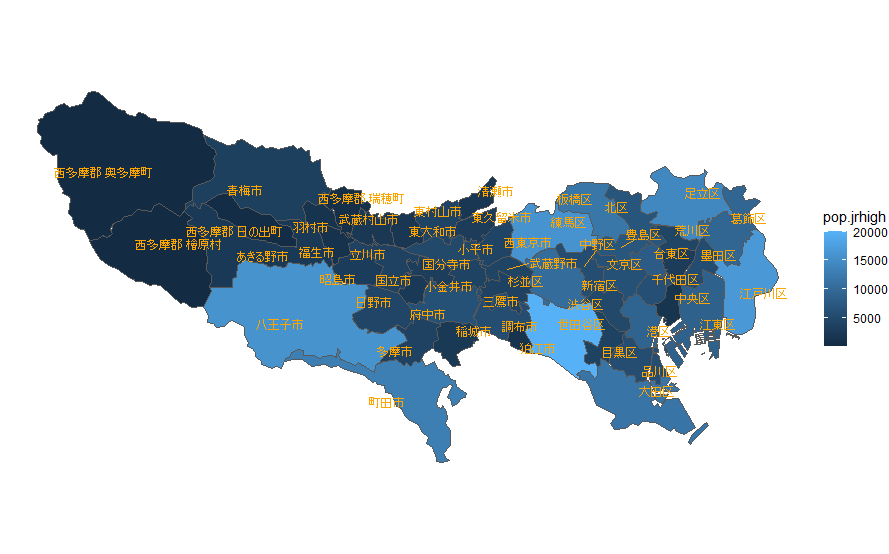
都心の周辺と、八王子、町田の中学生人口が多いですね。
