【R】ecodata
2021年4月19日
1. はじめに
ecodataは、Ecosystems Dynamics and Assessment Branch of the Northeast Fisheries Science Centerがまとめたエコシステム(生態系)のデータセットです。
2. インストール
Githubからインストールします。
remotes::install_github("noaa-edab/ecodata",build_vignettes=TRUE)3. つかってみる
データは、パッケージをロードして、ecodata::にて取得できます。
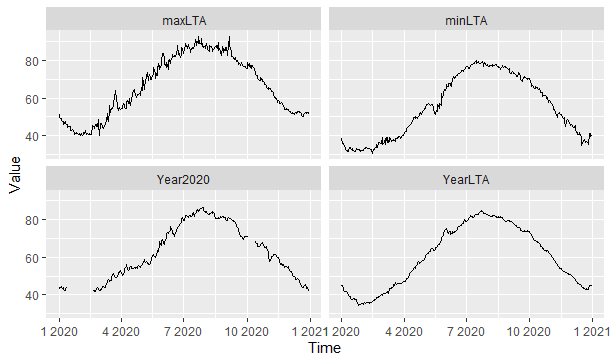
Chesapeake Bayの海水温度を取得してグラフを描いてみます。
library(ecodata)
library(ggplot2)
dat <- ecodata::ch_bay_temp

ggplot(dat, aes(Time, Value))+
  geom_line()+
  facet_wrap(~Var)

データはたくさんあります。
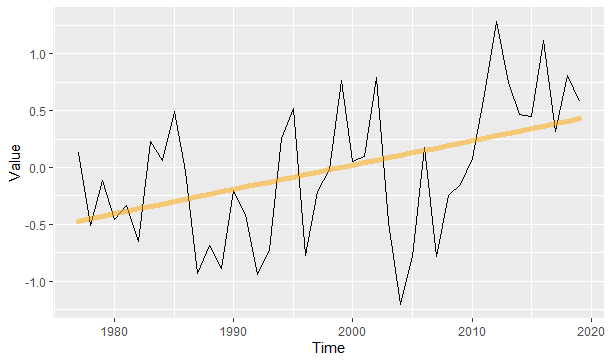
その他、ggplotのgeomも提供されています。データのトレンドを計算して表示してくれます。
library(tidyverse)
dat2 <- ecodata::bottom_temp %>%
  filter(Var == "bottom temp anomaly in situ") %>%
  filter(EPU == "GB" )

ggplot(data = dat2, aes(x = Time, y = Value)) +
  geom_line() +
  geom_gls()

4. さいごに
いろんなデータセットがあって楽しいですね。
