【R】鳥取県の人口別コロプレス図
2020年8月24日
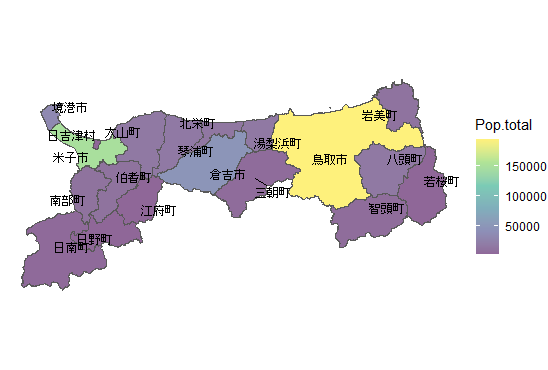
鳥取県の市区町村を人口別に塗りつぶしてみます。境界の描画は「地図で見る統計(統計GIS)」の「31000 鳥取県全域 世界測地系緯度経度・Shapefile」から取得します。
library(ggplot2)
library(ggrepel)
library(sf)
library(tidyverse)
library(kableExtra)

map <- read_sf("shp/h27ka31.shp") # 鳥取県のシェープファイル


dat <- map %>%
  group_by(CITY_NAME) %>% # 市名でグルーピング
  summarize('Pop.total' = sum(JINKO))  %>% # グループ単位で領域結合, 人口計算
  mutate( # 重心計算と座標値の抽出
    centroid = st_centroid(geometry),
    x = st_coordinates(centroid)[, 1],
    y = st_coordinates(centroid)[, 2]
  ) %>%
  arrange(desc(Pop.total))

dat %>%
  ggplot() +
  geom_sf(aes(fill = Pop.total)) +  # 人口毎に色分け
  coord_sf(datum = NA) +
  scale_fill_viridis_c(alpha = 0.6) +
  theme_void()+
  geom_text_repel(aes(x = x, y = y, label = CITY_NAME), col="black",
                  family = "JP4", size = 3)


table_df<-data.frame(市区町村=dat$CITY_NAME, 人口=dat$Pop.total)

library(clipr)
table_df %>%
  kable(align = "c", row.names=FALSE) %>%
  kable_styling(full_width = F) %>%
  column_spec(1, bold = T) %>%
  collapse_rows(columns = 1, valign = "middle") %>%
  write_clip
| 市区町村 | 人口 |
|---|---|
| 鳥取市 | 193717 |
| 米子市 | 149313 |
| 倉吉市 | 49044 |
| 境港市 | 34174 |
| 琴浦町 | 17416 |
| 八頭町 | 16985 |
| 湯梨浜町 | 16550 |
| 大山町 | 16470 |
| 北栄町 | 14820 |
| 岩美町 | 11485 |
| 伯耆町 | 11118 |
| 南部町 | 10950 |
| 智頭町 | 7154 |
| 三朝町 | 6490 |
| 日南町 | 4765 |
| 日吉津村 | 3439 |
| 日野町 | 3278 |
| 若桜町 | 3269 |
| 江府町 | 3004 |
