【R】DataExplorer
2021年2月2日
1. はじめに
DataExplorerは、データ探索を手助けしてくれるツールです。データ分析の前には、データの内容を確認することがまず、重要ですが、このパッケージでは、様々な表、グラフを自動的に生成しレポートしてくれます。
2. インストール
CRANからインストールできます。
install.packages("DataExplorer")3. 使ってみる。
以下のコマンドで、データ探索結果をhtml形式で出力してくれます。自動的にブラウザが立ち上がり、表示されます。
library(DataExplorer)
create_report(airquality)
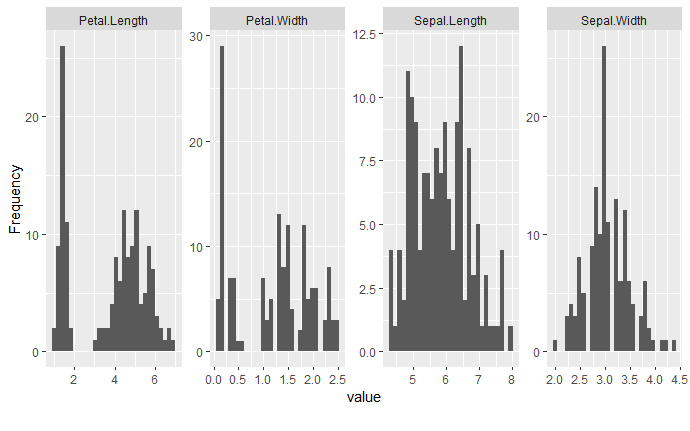
全ての変数のヒストグラムは、次で表示されます。
plot_histogram(iris)
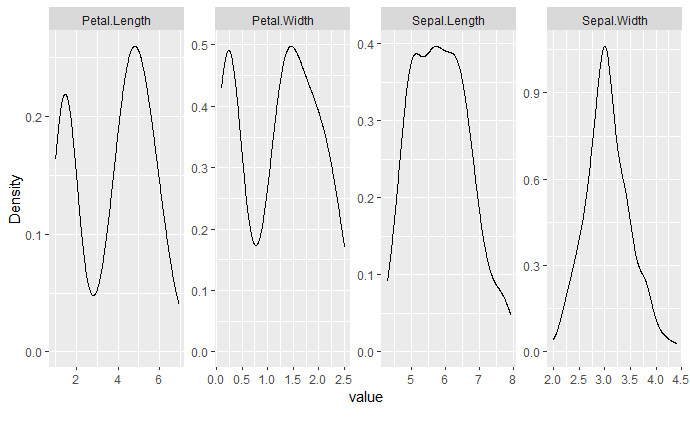
確率密度関数を描いてみます。
plot_density(iris)
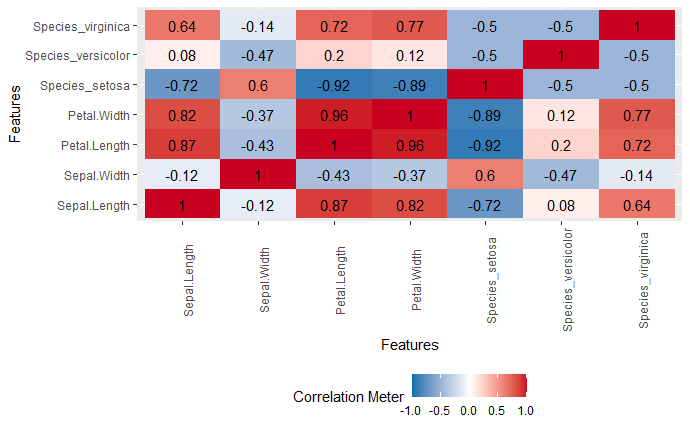
相関係数の表示。
plot_correlation(iris)
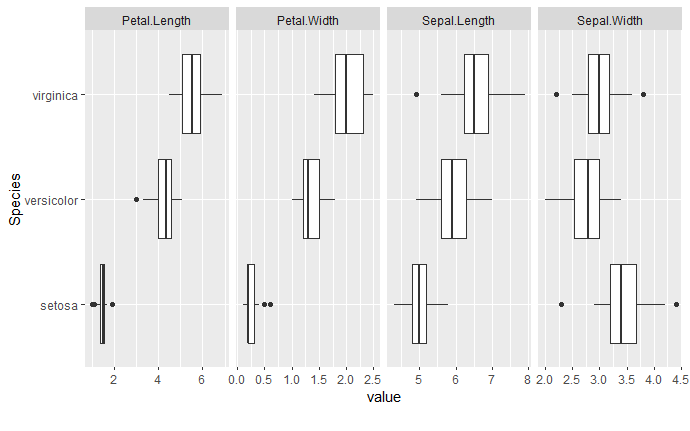
ボックスプロットです。
plot_boxplot(iris, by = "Species")
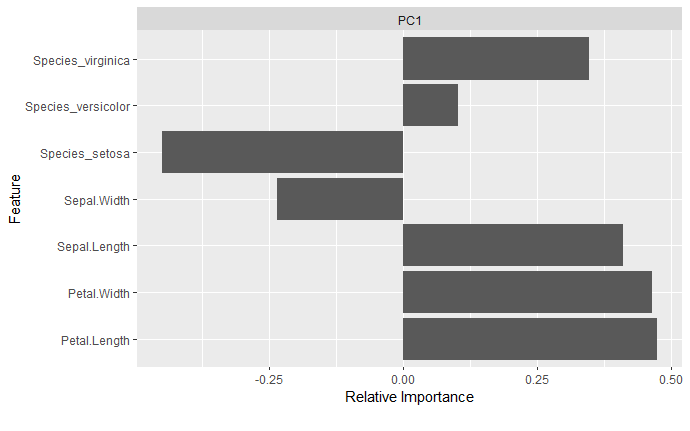
/主成分分析です。
plot_prcomp(iris, maxcat = 5L)
4. さいごに
データをさっと眺めることは、その後のステップの分析のために重要ですが、このパッケージならいろいろ手助けしてもらえそうです。
