【R】山口県の人口別コロプレス図
2020年8月26日
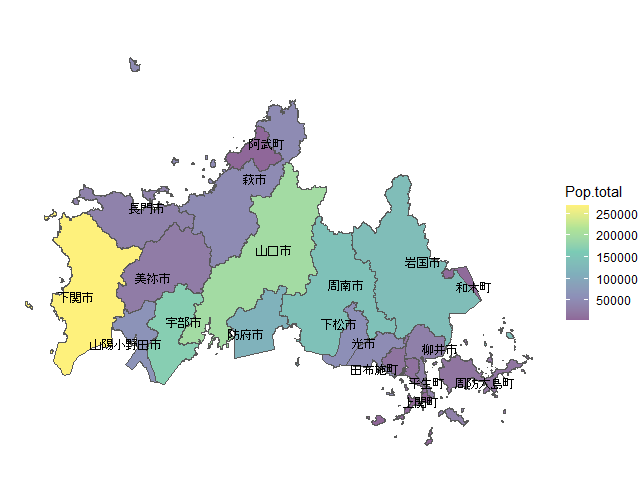
山口県の市区町村を人口別に塗りつぶしてみます。境界の描画は「地図で見る統計(統計GIS)」の「35000 山口県全域 世界測地系緯度経度・Shapefile」から取得します。
library(ggplot2)
library(ggrepel)
library(sf)
library(tidyverse)
library(kableExtra)

map <- read_sf("shp/h27ka35.shp") # 山口県のシェープファイル


dat <- map %>%
  group_by(CITY_NAME) %>% # 市名でグルーピング
  summarize('Pop.total' = sum(JINKO))  %>% # グループ単位で領域結合, 人口計算
  mutate( # 重心計算と座標値の抽出
    centroid = st_centroid(geometry),
    x = st_coordinates(centroid)[, 1],
    y = st_coordinates(centroid)[, 2]
  ) %>%
  arrange(desc(Pop.total))

dat %>%
  ggplot() +
  geom_sf(aes(fill = Pop.total)) +  # 人口毎に色分け
  coord_sf(datum = NA) +
  scale_fill_viridis_c(alpha = 0.6) +
  theme_void()+
  geom_text_repel(aes(x = x, y = y, label = CITY_NAME), col="black",
                  family = "JP4", size = 3)


table_df<-data.frame(市区町村=dat$CITY_NAME, 人口=dat$Pop.total)

library(clipr)
table_df %>%
  kable(align = "c", row.names=FALSE) %>%
  kable_styling(full_width = F) %>%
  column_spec(1, bold = T) %>%
  collapse_rows(columns = 1, valign = "middle") %>%
  write_clip
| 市区町村 | 人口 |
|---|---|
| 下関市 | 268517 |
| 山口市 | 197422 |
| 宇部市 | 169429 |
| 周南市 | 144842 |
| 岩国市 | 136757 |
| 防府市 | 115942 |
| 山陽小野田市 | 62671 |
| 下松市 | 55812 |
| 光市 | 51369 |
| 萩市 | 49560 |
| 長門市 | 35439 |
| 柳井市 | 32945 |
| 美祢市 | 26159 |
| 周防大島町 | 17199 |
| 田布施町 | 15317 |
| 平生町 | 12798 |
| 和木町 | 6285 |
| 阿武町 | 3463 |
| 上関町 | 2803 |
