【R】aussiemaps
2021年3月30日
1. はじめに
aussiemapsは、オーストラリアの地図データセットです。大元のデータはData.gov.auなどから取得したらしいです。
2. インストール
Githubからインストールします。
devtools::install_github("carlosyanez/aussiemaps")3. つかってみる
基本的に、load_map()で地図の準備ができるようです。
シドニー(Sydney)の地図を描いてみます。まずはデータの準備。都市の中心も求めます。
library(tidyverse)
library(ggplot2)
library(aussiemaps)

nsw_inner1_filter<- tibble(LGA=c("Sydney","New castle"),State=rep("NSW",2))

nsw_inner1 <-  load_map(nsw_inner1_filter,aggregation = "LGA")

nsw_inner1.centroid <- st_centroid(nsw_inner1)
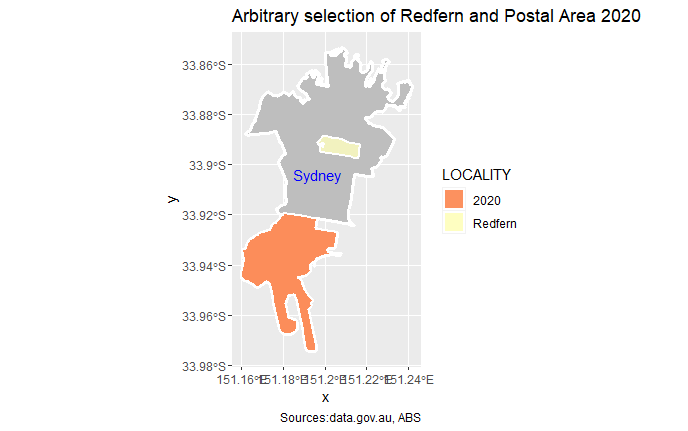
Redfernという町と郵便番号が2020の町をピックアップします。
nsw_inner2 <- tibble(LOCALITY=c("Redfern"),State=c("NSW")) %>%
  load_map()

nsw_inner3 <- tibble(POA_CODE16=c("2020"),State=c("NSW")) %>%
  load_map()
これらをまとめて描画します。
p <- ggplot() +
  geom_sf(data=nsw_inner1,colour="white",size=1.2,fill="grey") +
  geom_sf(data=nsw_inner2,aes(fill=LOCALITY),alpha=0.8,colour="white",size=0.8) +
  geom_sf(data=nsw_inner3,aes(fill=POA_CODE16),alpha=0.8,colour="white",size=0.8) +
  geom_sf_text(data = nsw_inner1.centroid, aes(label = LGA), colour = "blue") +
  scale_fill_brewer(palette = "Spectral") +
  labs(title="Arbitrary selection of Redfern and Postal Area 2020 in Sydney",
       caption="Sources:data.gov.au, ABS")

p
4. さいごに
OpenStreetMapなどと組み合わせても面白いですよね。
