【R】徳島県の人口別コロプレス図
2020年8月28日
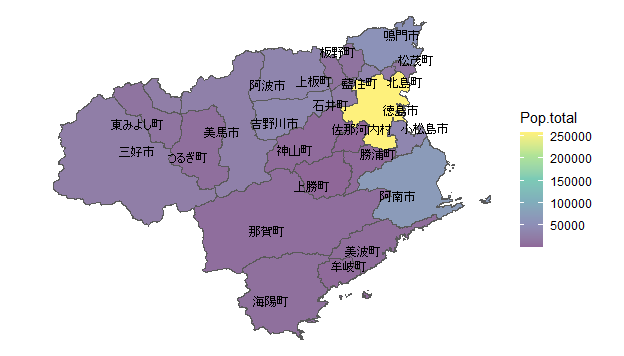
徳島県の市区町村を人口別に塗りつぶしてみます。境界の描画は「地図で見る統計(統計GIS)」の「36000 徳島県全域 世界測地系緯度経度・Shapefile」から取得します。
library(ggplot2)
library(ggrepel)
library(sf)
library(tidyverse)
library(kableExtra)

map <- read_sf("shp/h27ka36.shp") # 徳島県のシェープファイル


dat <- map %>%
  group_by(CITY_NAME) %>% # 市名でグルーピング
  summarize('Pop.total' = sum(JINKO))  %>% # グループ単位で領域結合, 人口計算
  mutate( # 重心計算と座標値の抽出
    centroid = st_centroid(geometry),
    x = st_coordinates(centroid)[, 1],
    y = st_coordinates(centroid)[, 2]
  ) %>%
  arrange(desc(Pop.total))

dat %>%
  ggplot() +
  geom_sf(aes(fill = Pop.total)) +  # 人口毎に色分け
  coord_sf(datum = NA) +
  scale_fill_viridis_c(alpha = 0.6) +
  theme_void()+
  geom_text_repel(aes(x = x, y = y, label = CITY_NAME), col="black",
                  family = "JP4", size = 3)


table_df<-data.frame(市区町村=dat$CITY_NAME, 人口=dat$Pop.total)

library(clipr)
table_df %>%
  kable(align = "c", row.names=FALSE) %>%
  kable_styling(full_width = F) %>%
  column_spec(1, bold = T) %>%
  collapse_rows(columns = 1, valign = "middle") %>%
  write_clip
| 市区町村 | 人口 |
|---|---|
| 徳島市 | 258554 |
| 阿南市 | 73019 |
| 鳴門市 | 59101 |
| 吉野川市 | 41466 |
| 小松島市 | 38755 |
| 阿波市 | 37202 |
| 藍住町 | 34626 |
| 美馬市 | 30501 |
| 三好市 | 26836 |
| 石井町 | 25590 |
| 北島町 | 22446 |
| 松茂町 | 15204 |
| 東みよし町 | 14638 |
| 板野町 | 13358 |
| 上板町 | 12039 |
| 海陽町 | 9283 |
| つるぎ町 | 8927 |
| 那賀町 | 8402 |
| 美波町 | 7092 |
| 勝浦町 | 5301 |
| 神山町 | 5300 |
| 牟岐町 | 4259 |
| 佐那河内村 | 2289 |
| 上勝町 | 1545 |
