【R】flexdashboardをGithubにdeploy
1. はじめに
GithubにはGithub Pages という機能があり、無料でWebsiteを構築できます。Rコミュニティでは広く使われているようで、様々なR markdownフォーマット(pkgdown, blogdown, bookdown)で活用されています。最近知ったのは、flexdashboardをdeployできるということで、試してみました。
Deploying flexdashboard on Github Pagesのページが非常にわかりやすかったので、こちらを参考にしました。
2. 必要なもの
最低限必要なものは、下記4点です。
・Githubレポジトリ
・flexdashboard, rmarkdownパッケージ
・flexdashboardファイル(*.rmd)
・_site.ymlファイル
3. 作ってみる
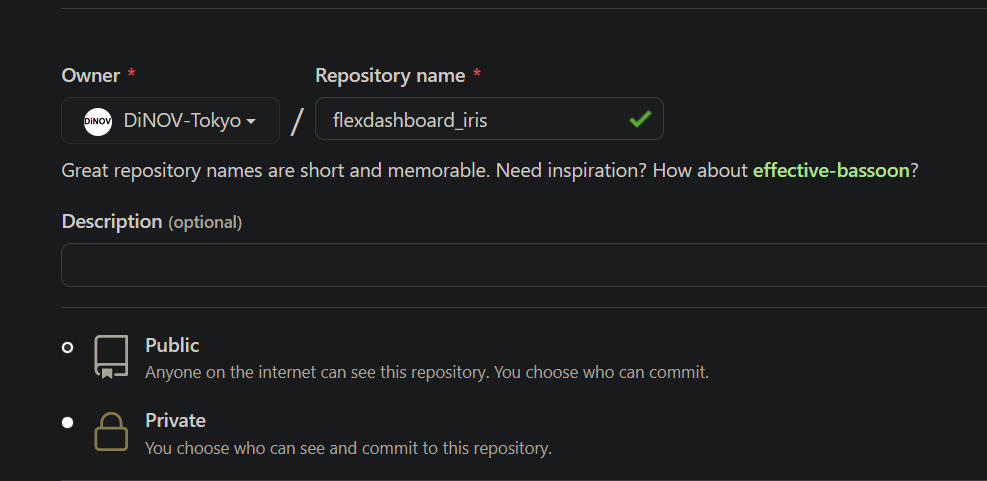
3.1 レポジトリ
まずは、レポジトリの設定です。新しくレポジトリを作ります。名前を設定して[create repository]ボタンを押します。
3.2 ローカルフォルダの作成
githubのoriginにsyncさせるフォルダを作ります。RStudioにて、
[File] -> [New Projuect] -> [New Directory] -> [New Project]で新しいプロジェクトを作ります。今回は、irisデータを使ったDashboardにしますので「flexdashboard_iris」としました。
3.3 _site.ymlファイルの作成
同じくRStudioにて、ファイルを作成します。
[File] -> [New File] -> [Text File]にて、新しいテキストファイルを作ります。通常は、GithubPageはdocsフォルダ内のデータをレンダリングするので、それをしています。下記の内容をテキストファイルにコピーします(最後に改行がないとErrorとなりました)。
name: "flexdashboard_iris"
output_dir: docs
ファイル名を、_site.ymlとして保存します。_site.ymlファイルについての詳細は、こちら。
3.4 flexdashboardファイルの準備
今回はtemplateを基にrmdファイルを作ります。
[File] -> [New File] -> [R Markdown]を選び、ダイアログから[From Template]を選択。[Flex Dashboard]を選んで[OK]を押します。内容を編集して、下記の通りとしました。
---
title: "Iris"
output:
  flexdashboard::flex_dashboard:
    orientation: rows
    vertical_layout: fill
date: "`r Sys.Date()`"
runitime: shiny
---

<style>
.navbar {
  background-color: #53e055;
  border-color: #53e055
}

.navbar-inverse .navbar-nav > li > a:hover,
.navbar-inverse .navbar-nav > li > a:focus {
    background-color: #ed8218;
    color: white;
}
.navbar-inverse .navbar-nav > .active > a,
.navbar-inverse .navbar-nav > .active > a:hover,
.navbar-inverse .navbar-nav > .active > a:focus {
  color: white;
  background-color: #ed8218;
}
.navbar-inverse .navbar-toggle:hover,
.navbar-inverse .navbar-toggle:focus {
  background-color: #ed8218;
}
.navbar-inverse .navbar-collapse,
.navbar-inverse .navbar-form {
  border-color: #ed8218;
}
</style>


```{r setup, include=FALSE}
library(flexdashboard)
library(knitr)
library(shiny)
library(tidyverse)

```

Analysis
=====================================

Row
-------------------------------------------------------------------------

### Iris measured

```{r n_iris}

n_iris <- nrow(iris)
valueBox(n_iris, icon = "fa-pencil", color = "#fa7404")

```

-------------------------------------------------------------------------

### Average sepal length

```{r sepal_length}

sepal_length <- paste0(round(mean(iris$Sepal.Length,
                                na.rm = TRUE)), " mm")
valueBox(sepal_length,
         icon = "fa-ruler", color = "#fa7404")

```

### Average sepal width

```{r sepal_width}

sepal_width <- paste0(round(mean(iris$Sepal.Width,
                                na.rm = TRUE)), " mm")
valueBox(sepal_width,
         icon = "fa-ruler", color = "#fa7404")

```

### Average petal length

```{r petal_length}

petal_length <- paste0(round(mean(iris$Petal.Length,
                                na.rm = TRUE)), " mm")
valueBox(petal_length,
         icon = "fa-ruler", color = "#fa7404")

```

### Average petal width

```{r petal_width}

petal_width <- paste0(round(mean(iris$Petal.Width,
                                na.rm = TRUE)), " mm")
valueBox(petal_width,
         icon = "fa-ruler", color = "#fa7404")

```


Row
-------------------------------------

### Sepal Length vs. Petal Length

```{r plot, echo = FALSE}

library(plotly)

length_plot <- ggplot(iris, aes(iris$Sepal.Length, iris$Petal.Length)) +
  geom_point(aes(color = Species), size = 3, alpha = 0.8) +
  theme_minimal() +
  scale_color_manual(values = c("darkorange","purple","cyan4")) +
  labs(x = "Sepal length [mm]",
       y = "Petal length [mm]",
       color = "Iris species")

ggplotly(length_plot)

```

Column
---------------------------------------
### Histogram of iris sepal width

```{r iris_sepal_hist, echo = FALSE}

ggplot(iris, aes(iris$Sepal.Width)) +
  geom_histogram(aes(fill = Species),
                 alpha = 0.5,
                 position = "identity") +
  scale_color_manual(values = c("darkorange","purple","cyan4")) +
  theme_minimal() +
  labs(x = "Sepal width [mm]",
       y = "Frequency",
       title = "Iris Sepal Width")

```

---------------------------------------
### Histogram of iris petal width

```{r iris_petal_hist, echo = FALSE}

ggplot(iris, aes(iris$Petal.Width)) +
  geom_histogram(aes(fill = Species),
                 alpha = 0.5,
                 position = "identity") +
  scale_color_manual(values = c("darkorange","purple","cyan4")) +
  theme_minimal() +
  labs(x = "Petal width [mm]",
       y = "Frequency",
       title = "Iris Petal Width")

```


Raw Data
=====================================

Row
-------------------------------------

### Data Table of Raw Data

```{r table}
DT::datatable(iris, options = list(
  pageLength = 25,
  height = "600px"
))
```

Row {data-height=100}
-------------------------------------

```{r download}

library(shiny)

fluidRow(
  downloadHandler(filename = function() {
    return("iris.csv")

 }, content = function(file) {
   write.csv(iris, file)
 })
)

```
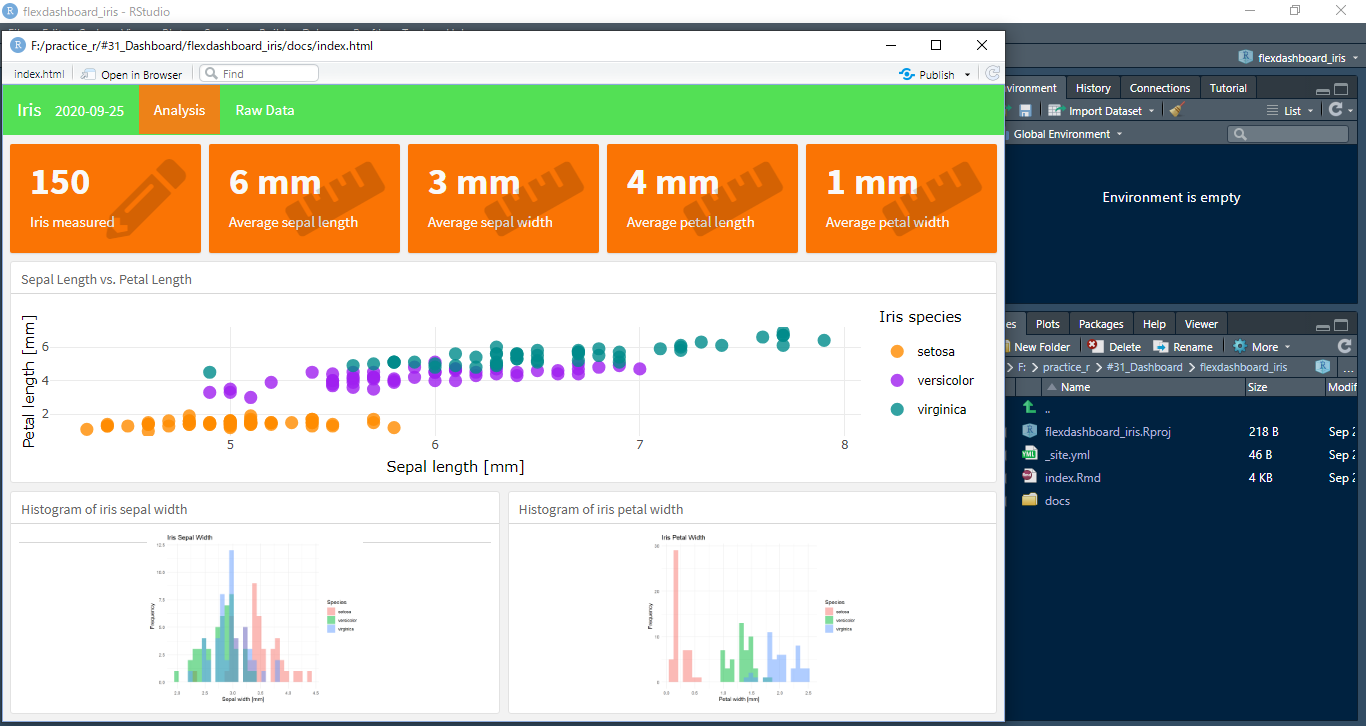
このファイルをindex.rmdという名前を保存します。ここが重要で、websiteとして表示するには、この名前である必要があります。
これで、レンダリングの準備ができました。knitすると、次のようにDashboardが表示されます。RStudioのファイルを見ると、_site.ymlで指定したように、docsフォルダができています。
3.5 GithubとSync
最後に、Websiteとして表示させるためにローカルフォルダとレポジトリのoriginとsyncさせます。
僕は、PortableGitを使用しているのですが、このターミナルから、プロジェクトのあるフォルダに移動して、以下のコマンドでフォルダの内容をコミットします。
git init
git add *
git commit -m "init commit"
git branch -M master
git branch -M master
git remote add origin git@github.com:DiNOV-Tokyo/flexdashboard_iris.git
git push -u origin master
さあ、問題がなければこれで完成です。最後に一仕事。
3.6 Github pageの設定
最後の一仕事は、Githubにて、[settings] -> [options] -> [Github page]にて、branchをmasterにして、フォルダをdocsに変更します。
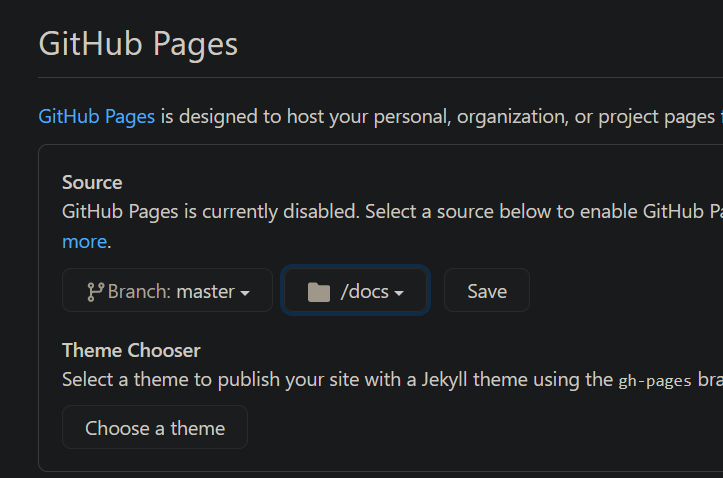
最後に、[Save]ボタンを押します。これで、flexdashboardが
https://Your_Github_User_Name.github.io/Repository_Name
にて表示されます。僕の場合は、
https://dinov-tokyo.github.io/flexdashboard_iris/
です。
4. さいごに
GithubでDashboardを動かせるとは(しかも無料で)知らなかったので、新しい発見でした。これなら、気軽にいろいろ作ってみてもよさそうです。
