【R】電話契約数
2020年11月11日
1. はじめに
TidyTuesdayのデータで固定/携帯電話の世界の契約数のデータがあったので、眺めてみます。
2. 見てみる。
library(tidyverse)
library(tidytuesdayR)
library(tmap)

mobile <- readr::read_csv('https://raw.githubusercontent.com/rfordatascience/tidytuesday/master/data/2020/2020-11-10/mobile.csv')
landline <- readr::read_csv('https://raw.githubusercontent.com/rfordatascience/tidytuesday/master/data/2020/2020-11-10/landline.csv')

data("World")
options(scipen = 999)

df <- inner_join(mobile, landline, by=c("code", "year", "entity", "continent", "gdp_per_cap"))

dat <- df %>% filter(year=="2013")%>%
  gather(key = "phoneType", value = "subs", -entity, -code, -total_pop.x, -total_pop.y, -gdp_per_cap, -continent, -year) %>%
  filter(phoneType=="mobile_subs") %>%
  rename("name" = entity)

dat2 <- World %>%
  select(name, HPI, geometry) %>%
  left_join(dat, by="name")

tm_shape(dat2) + tm_polygons("total_pop.x", palette = "RdYlBu") +
   tm_bubbles("subs", col="gdp_per_cap") +
  tm_facets(by="continent")
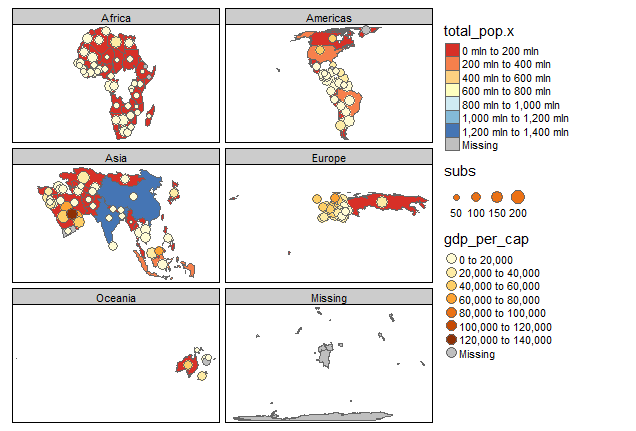
地域ごとに見ようと思いましたが、別に地図を分ける必要がなかったかも。。。
人口(total_pop.x)とGDP(gdp_per_cap)で携帯電話の契約数(subs)が影響あるかと思ったんですが、ほとんどの国で広くいきわたっているようで、あまり影響がないようです。
df2 <- df %>%
  filter(entity == "Japan" |entity == "Germany" |entity == "China"   |entity == "Kenya" |entity == "South Korea" |entity == "Brazil"  ) %>%
  gather(key = "phoneType", value = "subs", -entity, -code, -total_pop.x, -total_pop.y, -gdp_per_cap, -continent, -year)

df2$inv <-  ifelse(df2$phoneType =="landline_subs",df2$subs+1,df2$subs)
df2 <- df2 %>% mutate(inv = ifelse(phoneType =="mobile_subs",subs,subs*-1))


df2 %>%
  ggplot(aes(x = year, y = inv, fill = phoneType))+
  geom_bar(stat = "identity", position = "identity")+
  geom_hline(yintercept = 0, color = "white")+
  scale_y_continuous(breaks = seq(from = -75, to = 125, by = 25), labels=abs(seq(from = -75, to = 125, by = 25)))+
  scale_x_continuous(breaks = seq(from = 1990, to = 2017, by = 10))+
  scale_fill_manual(name = "Phone Type", labels = c("Landline", "Mobile"), values = c("#FC6600", "#0A85C9"))+
  labs(
    x = "Year",
    y = "Phone Subs per 100 People",
    fill = "Phone Type",
    title ="Phone Subscriptions"
  )+
  theme(
    plot.background = element_rect(fill = "#161616"),
    panel.background = element_rect(fill = "#161616"),
    axis.text = element_text(color = "white", size = 10),
    axis.title = element_text(color = "white", size = 12),
    axis.ticks.y = element_blank(),
    axis.ticks.x = element_line(color = "white"),
    panel.grid = element_blank(),
    axis.line.x = element_line(color="white"),
    axis.line.y = element_line(color="white"),
    plot.title = element_text(color = "#8BBDD8", size = 20, hjust = .5, face = "bold"),
    legend.background = element_blank(),
    legend.text = element_text(color = "white", size = 10),
    legend.title = element_text(color = "#8BBDD8", size = 11),
    legend.key = element_blank()
  ) +
  facet_wrap(~entity)
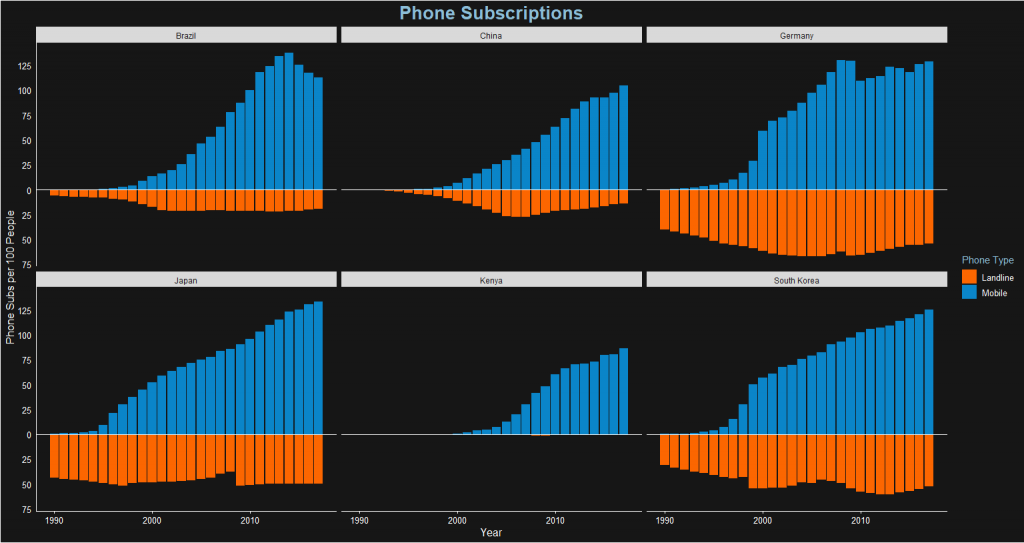
固定電話と携帯電話の契約数の時系列変化を見てみますと、後進国は固定電話の契約数が増える前に携帯電話が普及しています。固定電話はむしろ減少傾向の国もあります。ブラジルはなぜか携帯電話の契約数も減少しています。国によらず携帯電話の普及率はほぼ100%に近いんですね(もちろん1人で何台も持っている人もいるのでしょうけど)。
