【R】tsibbledata
2020年11月19日
1. はじめに
tsibbledataは、tidyverts(tidy tools to time series)で使いやすいデータセットです。
2. インストール
CRANからインストールできます。
install.packages("tsibbledata")3. 使ってみます。
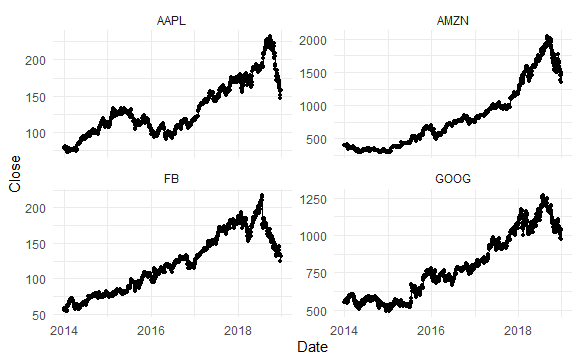
GAFAの株価の時系列データがあるようなので、表示してみます。
library(tsibbledata)
library(ggplot2)

data("gafa_stock")
gafa_stock
> gafa_stock
# A tibble: 5,032 x 8
   Symbol Date        Open  High   Low Close Adj_Close    Volume
   <chr>  <date>     <dbl> <dbl> <dbl> <dbl>     <dbl>     <dbl>
 1 AAPL   2014-01-02  79.4  79.6  78.9  79.0      67.0  58671200
 2 AAPL   2014-01-03  79.0  79.1  77.2  77.3      65.5  98116900
 3 AAPL   2014-01-06  76.8  78.1  76.2  77.7      65.9 103152700
 4 AAPL   2014-01-07  77.8  78.0  76.8  77.1      65.4  79302300
 5 AAPL   2014-01-08  77.0  77.9  77.0  77.6      65.8  64632400
 6 AAPL   2014-01-09  78.1  78.1  76.5  76.6      65.0  69787200
 7 AAPL   2014-01-10  77.1  77.3  75.9  76.1      64.5  76244000
 8 AAPL   2014-01-13  75.7  77.5  75.7  76.5      64.9  94623200
 9 AAPL   2014-01-14  76.9  78.1  76.8  78.1      66.1  83140400
10 AAPL   2014-01-15  79.1  80.0  78.8  79.6      67.5  97909700
# ... with 5,022 more rows
ggplot(gafa_stock, aes(x=Date, y = Close)) +
geom_line() +
geom_point(size = 1) +
facet_wrap(~ Symbol, scales = "free_y", nrow = 2) +
theme_minimal() +
scale_color_brewer(palette = "Dark2") +
theme(legend.position = "bottom", legend.title = element_blank()) +
ylab("Close")

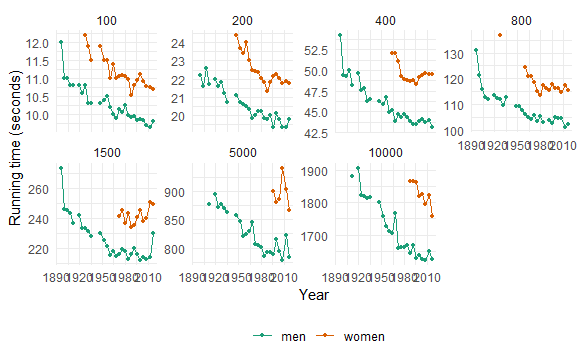
こんな例もありましたので、そのまま載せてみます。
ggplot(olympic_running, aes(x=Year, y = Time, colour = Sex)) +
  geom_line() +
  geom_point(size = 1) +
  facet_wrap(~ Length, scales = "free_y", nrow = 2) +
  theme_minimal() +
  scale_color_brewer(palette = "Dark2") +
  theme(legend.position = "bottom", legend.title = element_blank()) +
  ylab("Running time (seconds)")

4. さいごに
時系列データが必要な時には、役に立ちそうですね。
