【R】paletteR
2020年12月1日
1. はじめに
paletteRは、イメージ画像からパレットを生成してくれるパッケージです。kmeans法で色を取り出しているようです。詳しい技術背景はこちら。
2. インストール
Githubからインストールします。
devtools::install_github("AndreaCirilloAC/paletter")3. 使ってみる
画像をfreepikからとってきた画像を使ってみます。

library(paletter)
library(ggplot2)

image_path <- "image.jpg"
colours_vector <- create_palette(image_path = image_path,
                                 number_of_colors =32,
                                 type_of_variable = "categorical")

ggplot(data = mtcars, aes(x = rownames(mtcars),y = hp,color = rownames(mtcars),
                          fill = rownames(mtcars))) +
  geom_bar(stat = 'identity') +
  scale_color_manual(values = colours_vector) +
  scale_fill_manual(values=colours_vector)+
  theme_minimal() +
  guides(size = FALSE) +
  theme(legend.position = "bottom") +
  labs(title = "disp vs hp")+
  coord_flip()
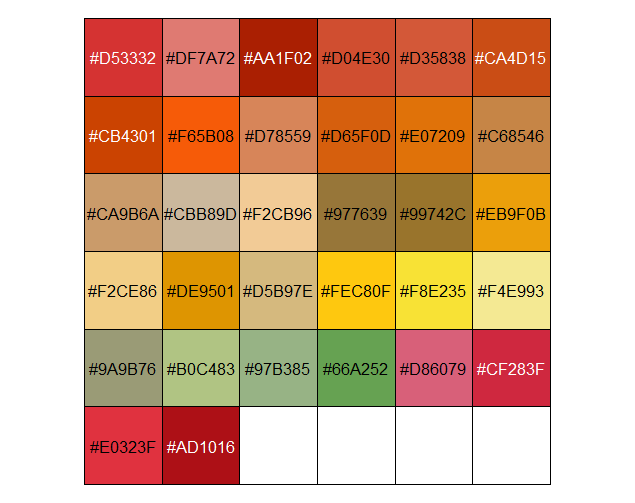
できあがったパレットがこちら。
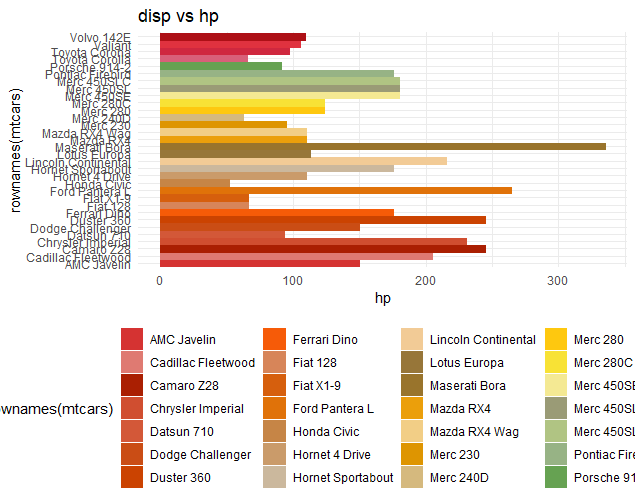
ggplotで棒グラフ状に表示。
4. さいごに
というわけで、パレットを作ってくれるパッケージでした。
