【R】devoutrgl
2020年12月3日
1. はじめに
devoutrglは、{rgl}を用いて様々なプロットをインタラクティブな3Dで表示してくれるデバイスです。
2. インストール
Githubからインストールします。
remotes::install_github("coolbutuseless/devout")
remotes::install_github("coolbutuseless/devoutrgl")
3. 使ってみる
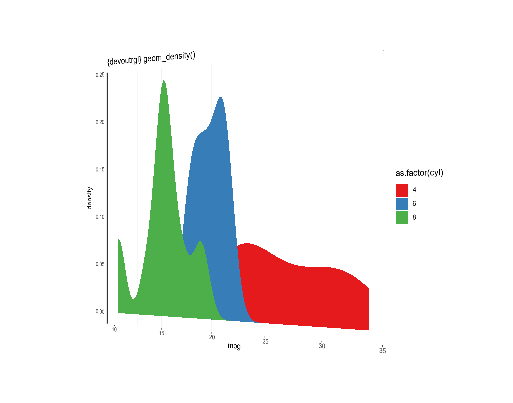
様々なプロットを表示できますが、ここでは、density plotを表示させてみます。
library(ggplot2)
library(devoutrgl)

p <- ggplot(mtcars) +
  geom_density(aes(mpg, fill=as.factor(cyl)), colour = '#ffffff00') +
  theme(legend.position = 'none') +
  scale_fill_brewer(palette = 'Set1') +
  theme_bw() +
  labs(title = "{devoutrgl} geom_density()")


rgldev(fov = 30, view_angle = 30)
p
invisible(dev.off())
新しいウインドウが表示されて、ぐりぐり動かせます。
4. さいごに
ggplotでgeom_point3d()を使えればもっと面白いのですが、使えず。。。。
