【R】ggdist
2020年12月16日
1. はじめに
ggdistは、distributions と uncertaintyを可視化するパッケージです。
2. インストール
CRANからインストールできます。
install.packages("ggdist")3. 使ってみる
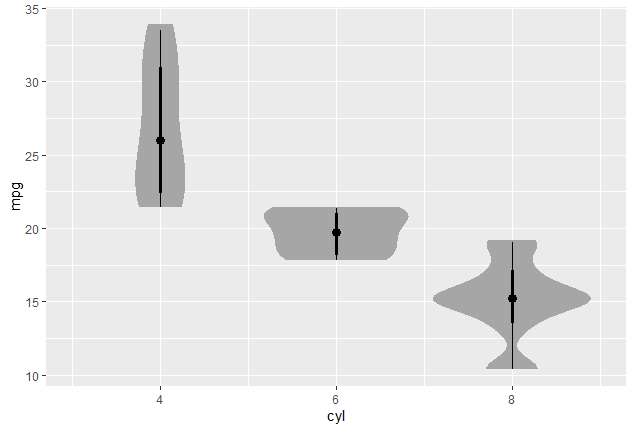
library(ggplot2)
library(ggdist)

mtcars

ggplot(mtcars) +
  aes(x=cyl, y=mpg)+
  stat_eye()
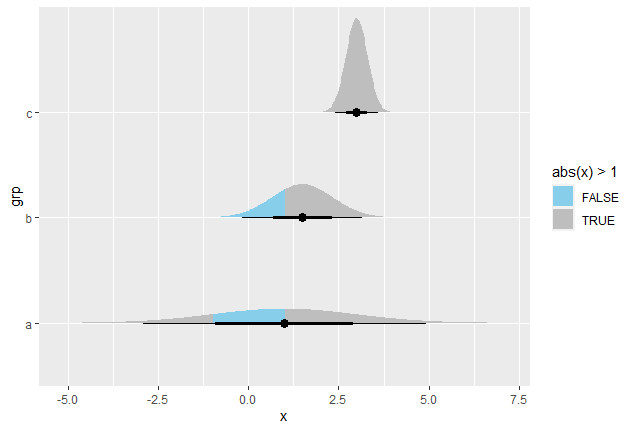
library(distributional)


df = data.frame(
    grp = c("a", "b", "c"),
    mean = c(1, 1.5, 3),
    sd = c(2, 0.85, 0.3)
)

ggplot(df)+
  aes(y=grp,
      dist=dist_normal(mean, sd),
      fill = stat(abs(x)>1)
  )+
  stat_dist_halfeye() +
  scale_fill_manual(values=c("skyblue", "gray"))
4. さいごに
CheatSheetsはこちら。
