【R】esvis
2020年12月30日
1. はじめに
esvisは、分布の差を可視化してくれるパッケージです。
2. インストール
CRANからインストールします。
install.packages("esvis")3. 使ってみる
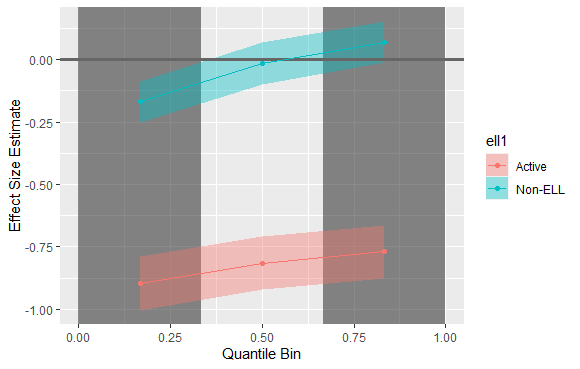
library(esvis)
binned_plot(benchmarks, math ~ ell)
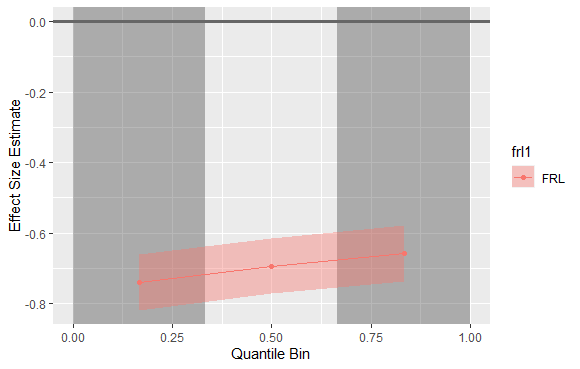
binned_plot(benchmarks, reading ~ frl)
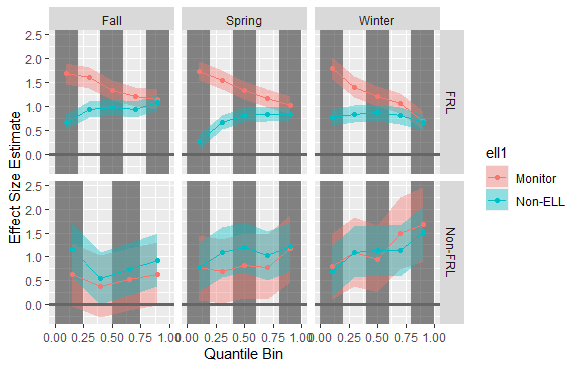
binned_plot(benchmarks,
            math ~ ell + frl + season,
            ref_group = "Non-ELL",
            qtile_groups = 5)
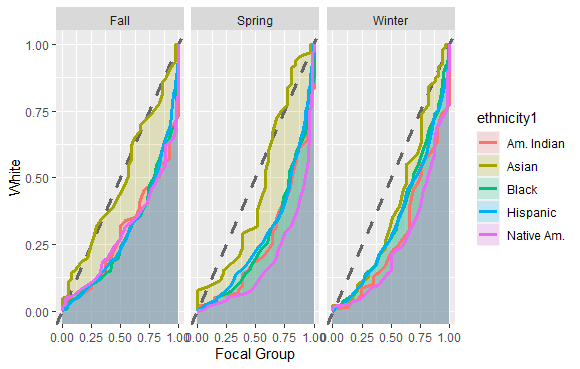
pp_plot(benchmarks, math ~ ethnicity + season)
4. さいごに
分析に役立ちそう。
