【R】highcharter
2020年12月31日
1. はじめに
highcharterは、highchartのWrapperで、同じくjavascriptで柔軟なチャートを表示します。
2. インストール
CRANからインストールします。
install.packages("highcharter")3. 使ってみる
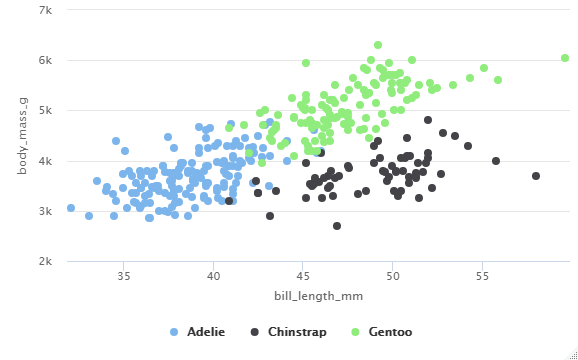
library(highcharter)
data(penguins, package = "palmerpenguins")

hchart(penguins, "scatter", hcaes(x = bill_length_mm, y = body_mass_g, group = species))
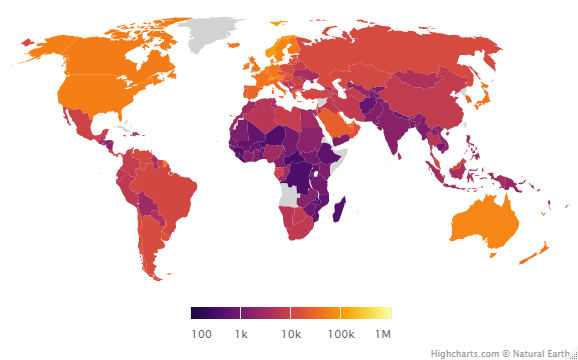
data(GNI2014, package = "treemap")

hcmap(
  "custom/world-robinson-lowres",
  data = GNI2014,
  name = "Gross national income per capita",
  value = "GNI",
  borderWidth = 0,
  nullColor = "#d3d3d3",
  joinBy = c("iso-a3", "iso3")
) %>%
  hc_colorAxis(
    stops = color_stops(colors = viridisLite::inferno(10, begin = 0.1)),
    type = "logarithmic"
  )
4. さいごに
Plotlyのように扱えて素晴らしいです!
