【R】edgebundle
2021年1月2日
1. はじめに
edgebundleはエッジ結合やメトロマップを表示するパッケージです。以下の機能を含んでいます。
- Force directed edge bundling (paper)
- Stub bundling (paper)
- Hammer bundling (python code)
- TNSS flow map (paper)
- Multicriteria Metro map layout (paper)
2. インストール
Githubでインストールします。
remotes::install_github("schochastics/edgebundle")3. 使ってみる。
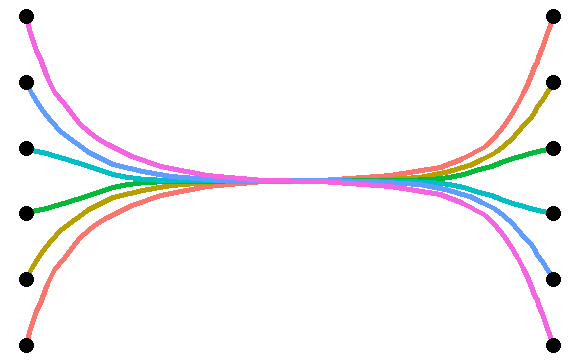
まずは、グラフ(igraph/network か tbl_graph object)とノードをつくります。
library(edgebundle)
library(igraph)
g <- graph_from_edgelist(
  matrix(c(1,12,2,11,3,10,4,9,5,8,6,7),ncol=2,byrow = T),F)
xy <- cbind(c(rep(0,6),rep(1,6)),c(1:6,1:6))

fbundle <- edge_bundle_force(g,xy,compatibility_threshold = 0.1)
head(fbundle)
           x        y      index group
1 0.00000000 1.000000 0.00000000     1
2 0.00611816 1.199768 0.03030303     1
3 0.00987237 1.297670 0.06060606     1
4 0.01929293 1.524269 0.09090909     1
5 0.02790686 1.686429 0.12121212     1
6 0.03440142 1.812852 0.15151515     1
ggplotで結果を見ることができます。
library(ggplot2)

ggplot(fbundle)+
  geom_path(aes(x,y,group=group,col=as.factor(group)),size = 2,show.legend = FALSE)+
  geom_point(data=as.data.frame(xy),aes(V1,V2),size=5)+
  theme_void()
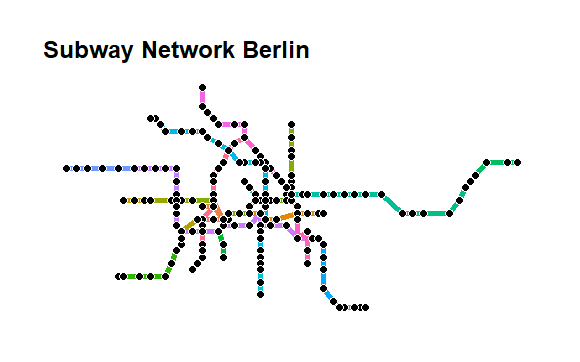
ベルリンのメトロネットワーク
library(ggraph)
g <- simplify(metro_berlin)
xy <- cbind(V(g)$lon,V(g)$lat)*100

xy_new <- metro_multicriteria(g,xy,l = 2,gr = 0.5,w = c(100,100,1,1,100),bsize = 35)

ggraph(metro_berlin,"manual",x=xy[,1],y=xy[,2])+
  geom_edge_link0(aes(col=route_I_counts),edge_width=2,show.legend = FALSE)+
  geom_node_point(shape=21,col="white",fill="black",size=3,stroke=0.5)

ggraph(metro_berlin,"manual",x=xy_new[,1],y=xy_new[,2])+
  geom_edge_link0(aes(col=route_I_counts),edge_width=2,show.legend = FALSE)+
  geom_node_point(shape=21,col="white",fill="black",size=3,stroke=0.5)+
  theme_graph()+
  ggtitle("Subway Network Berlin")
4. さいごに
グラフを簡単にかけますね。