【R】geobr
2021年1月23日
1. はじめに
geobrは、ブラジル関係のデータセットです。
2. インストール
CRANから、インストールできます。
install.packages(“geobr”)
3. 使ってみる
まず、どんなデータセットがあるか、確認します。
library(geobr)
library(ggplot2)
library(sf)
library(dplyr)

datasets <- list_geobr()
> datasets
# A tibble: 23 x 4
   `function`        geography              years                              source
   <chr>             <chr>                  <chr>                              <chr>
 1 `read_country`    Country                1872, 1900, 1911, 1920, 1933, 194~ IBGE
 2 `read_region`     Region                 2000, 2001, 2010, 2013, 2014, 201~ IBGE
 3 `read_state`      States                 1872, 1900, 1911, 1920, 1933, 194~ IBGE
 4 `read_meso_regio~ Meso region            2000, 2001, 2010, 2013, 2014, 201~ IBGE
 5 `read_micro_regi~ Micro region           2000, 2001, 2010, 2013, 2014, 201~ IBGE
 6 `read_intermedia~ Intermediate region    2017, 2019                         IBGE
 7 `read_immediate_~ Immediate region       2017, 2019                         IBGE
 8 `read_weighting_~ Census weighting area~ 2010                               IBGE
 9 `read_census_tra~ Census tract (setor c~ 2000, 2010, 2017                   IBGE
10 `read_municipal_~ Municipality seats (s~ 1872, 1900, 1911, 1920, 1933, 194~ IBGE
# ... with 13 more rows
たくさんありますね。
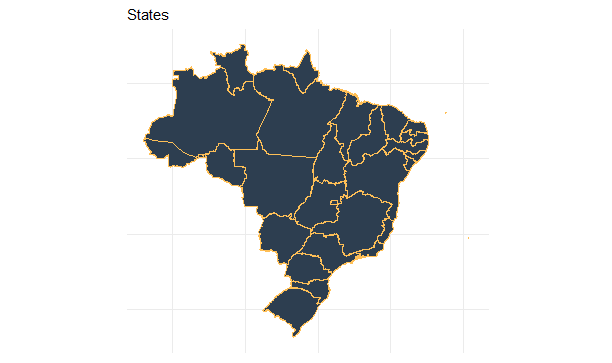
地図を描いてみます。
meso <- read_intermediate_region(year=2017)
states <- read_state(year=2019)

no_axis <- theme(axis.title=element_blank(),
                 axis.text=element_blank(),
                 axis.ticks=element_blank())


ggplot() +
  geom_sf(data=states, fill="#2D3E50", color="#FEBF57", size=.15, show.legend = FALSE) +
  labs(subtitle="States", size=8) +
  theme_minimal() +
  no_axis
4. さいごに
ブラジル行ったことないから行きたいなあ。
