【R】ggplotのcolor設定
2021年5月21日
グラフを作成するときに気に入った色にならなくて悩むことが多いのですが、こちらのポストを参考に色をカスタマイズできることを知りました。
やってみました。
色の定義とそれを使う関数の設定です。
c_colors <- c(
  `c_red`        = "#df4219",
  `c_green`      = "#04a5a8",
  `c_blue`       = "#01abdb",
  `c_orange`     = "#f37938",
  `c_yellow`     = "#fec415",
  `c_light grey` = "#ccccdd",
  `c_dark grey`  = "#8d9d8d")

c_cols <- function(...) {
  cols <- c(...)

  if (is.null(cols))
    return (c_colors)

  c_colors[cols]
}

c_cols("c_red")
> c_cols()
       c_red      c_green       c_blue     c_orange     c_yellow c_light grey  c_dark grey
   "#df4219"    "#04a5a8"    "#01abdb"    "#f37938"    "#fec415"    "#ccccdd"    "#8d9d8d"
> c_cols("c_red")
c_red
"#df4219" これで準備ができました。実際にggplotでグラフを書いてみます。
library(ggplot2)

ggplot(iris, aes(Petal.Length, Petal.Width)) +
  geom_point(col = c_cols("c_red"), size = 2, alpha = .6)
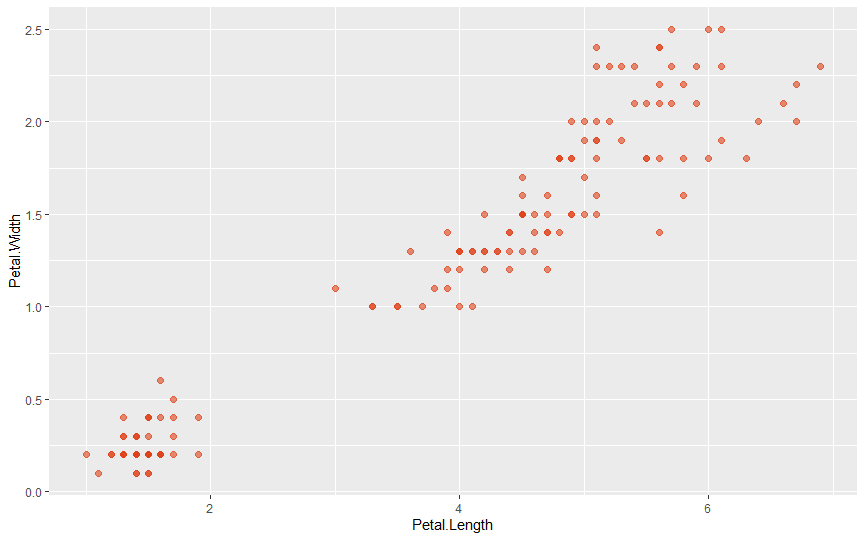
はい、できました!
次にパレットを作ってみます。
パレットをリストで定義して、それにアクセスする関数を準備します。
c_palettes <- list(
  `main`  = c_cols("c_blue", "c_green"),

  `cool`  = c_cols("c_blue", "c_green", "c_light grey"),

  `hot`   = c_cols("c_yellow", "c_orange", "c_red")
)

c_pal <- function(palette = "main", reverse = FALSE, ...) {
  pal <- c_palettes[[palette]]

  if (reverse) pal <- rev(pal)

  colorRampPalette(pal, ...)
}
確認してみます。
c_pal("hot")
> c_pal("hot")
function (n)
{
    x <- ramp(seq.int(0, 1, length.out = n))
    if (ncol(x) == 4L)
        rgb(x[, 1L], x[, 2L], x[, 3L], x[, 4L], maxColorValue = 255)
    else rgb(x[, 1L], x[, 2L], x[, 3L], maxColorValue = 255)
}
<bytecode: 0x0000025a3b09eb30>
<environment: 0x0000025a3b0a17e0>
パレットに設定した以上の色は内挿されて作られます。
> c_pal("cool")(10)
 [1] "#01ABDB" "#01A9CF" "#02A8C4" "#03A7B9" "#03A5AD" "#1AA9AD" "#46B2B9" "#73BAC5" "#9FC3D1"
[10] "#CCCCDD"
では、ggplotのcolorとfillのパラメータで設定できるように関数を定義します。
scale_color_c <- function(palette = "main", discrete = TRUE, reverse = FALSE, ...) {
  pal <- c_pal(palette = palette, reverse = reverse)

  if (discrete) {
    discrete_scale("colour", paste0("drsimonj_", palette), palette = pal, ...)
  } else {
    scale_color_gradientn(colours = pal(256), ...)
  }
}

scale_fill_c <- function(palette = "main", discrete = TRUE, reverse = FALSE, ...) {
  pal <- c_pal(palette = palette, reverse = reverse)

  if (discrete) {
    discrete_scale("fill", paste0("drsimonj_", palette), palette = pal, ...)
  } else {
    scale_fill_gradientn(colours = pal(256), ...)
  }
}
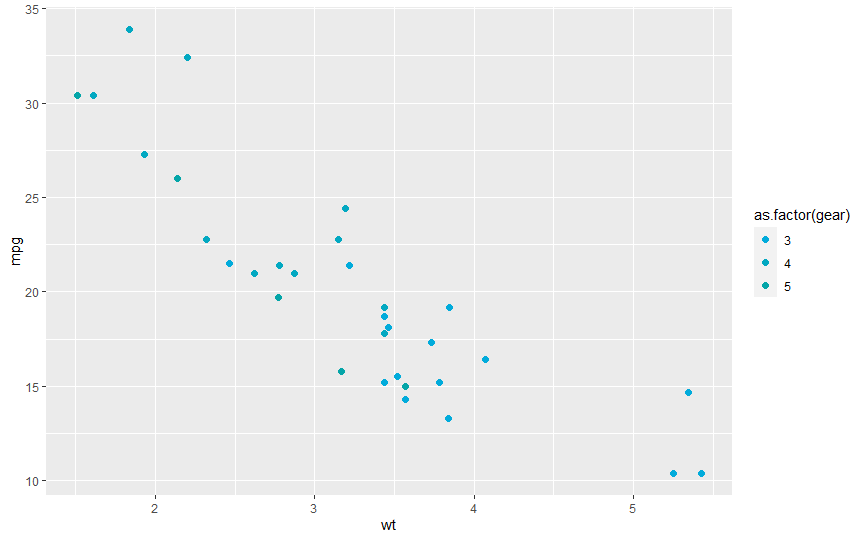
プロットしてみます。
ggplot(mtcars, aes(wt, mpg, color = as.factor(gear))) +
  geom_point(size = 2) +
  scale_color_c()
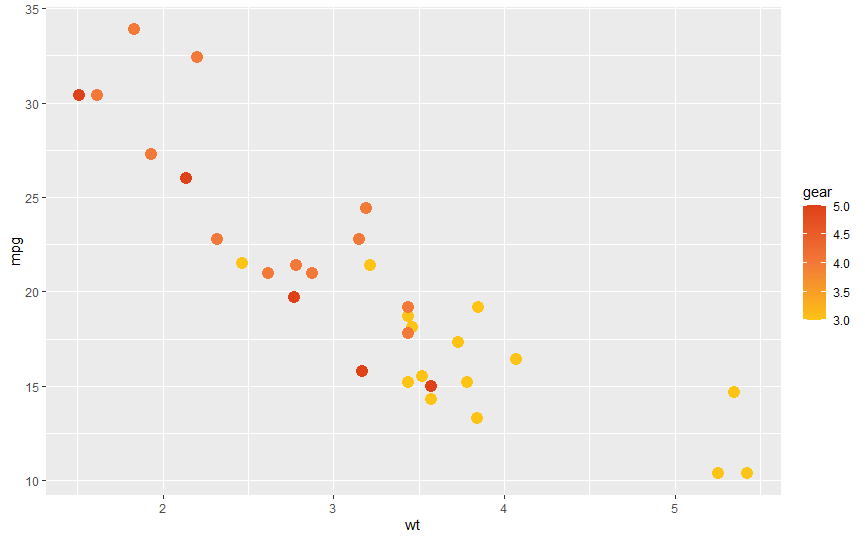
ggplot(mtcars, aes(wt, mpg, color = gear)) +
  geom_point(size = 4) +
  scale_color_c(discrete = FALSE, palette = "hot")
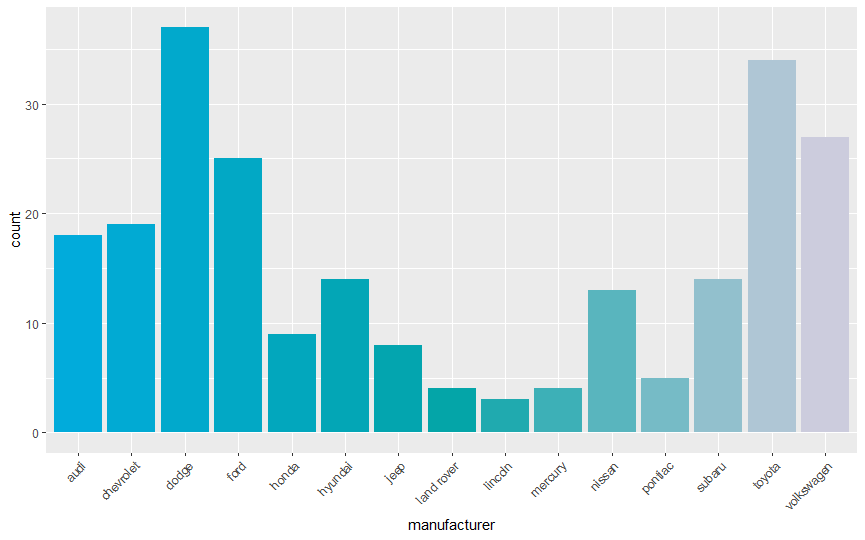
ggplot(mpg, aes(manufacturer, fill = manufacturer)) +
  geom_bar() +
  theme(axis.text.x = element_text(angle = 45, hjust = 1)) +
  scale_fill_c(palette = "cool", guide = "none")
パレットについて理解できた気がします。これからも活用しよう!