【R】ggiraph
2021年1月26日
1. はじめに
ggiraphは、tooltipsやjavascriptなどでダイナミックなグラフを描けるパッケージです。
2. インストール
CRANからインストールできます。
install.packages("ggiraph")3. 使ってみる
使い方は簡単。geom_pointの代わりにgeom_point_interactiveを、geom_sfの代わりに geom_sf_interactiveを使います。
最後にgirafe関数を呼びます。
まずは、例にあるプロットをしてみます。
library(ggplot2)
library(ggiraph)
data <- mtcars
data$carname <- row.names(data)

gg_point = ggplot(data = data) +
    geom_point_interactive(aes(x = wt, y = qsec, color = disp,
    tooltip = carname, data_id = carname)) +
  theme_minimal()

girafe(ggobj = gg_point)
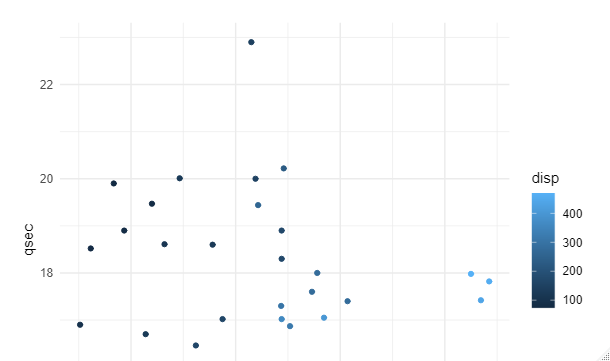
プロット上にマウスカーソルを合わせると、carnameがtooltipsとして表示されます。
次に地図を描いてみます。
library(rnaturalearth)
library(ggplot2)
library(ggrepel)
library(tidyverse)
library(sf)
library(kableExtra)
asia <- rnaturalearth::ne_countries(
  continent = "Asia",
  returnclass = "sf"
)

dat <- asia %>%
  mutate(
    centroid = st_centroid(geometry),
    x = st_coordinates(centroid)[, 1],
    y = st_coordinates(centroid)[, 2]
  ) %>%
  arrange(desc(pop_est))

gg_point = ggplot(data = dat) +
  geom_sf_interactive(aes(color = pop_est, fill = pop_est,
                             tooltip = name_long)) +
  theme_minimal()

girafe(ggobj = gg_point)
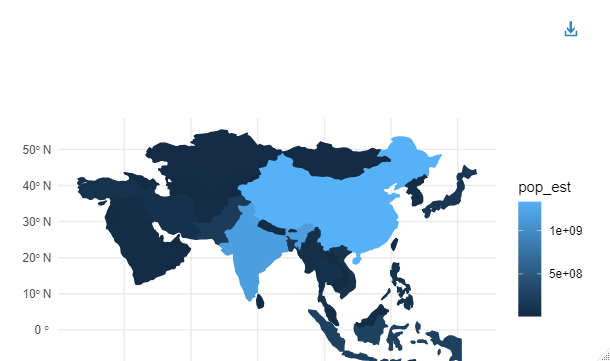
国の領域にマウスカーソルを合わせると国名が表示されます。データのダウンロードもできます。
4. さいごに
Webアプリ作成の知識がなくてもダイナミックなプロットができるとうれしいですね。ちなみにShinyでも動くようです。
