【R】tidyquant
2021年3月14日
1. はじめに
tidyquantは、金融データの収集、分析に役立つパッケージです。
2. インストール
CRANからインストールできます。
install.packages("tidyquant")3. 使ってみる
まずは、データの取得。出力はtibbleです。アマゾンの株価を取得してみます。
library(tidyquant)
amzn_prices <- tq_get(“AMZN”, get = “stock.prices”)
> head(amzn_prices)
# A tibble: 6 x 8
  symbol date        open  high   low close  volume adjusted
  <chr>  <date>     <dbl> <dbl> <dbl> <dbl>   <dbl>    <dbl>
1 AMZN   2011-01-03  181.  186   181.  184. 5331400     184.
2 AMZN   2011-01-04  186.  188.  184.  185. 5031800     185.
3 AMZN   2011-01-05  184.  187.  184.  187. 3418800     187.
4 AMZN   2011-01-06  186.  187.  185.  186. 3179700     186.
5 AMZN   2011-01-07  188.  188.  184.  185. 5221700     185.
6 AMZN   2011-01-10  185.  185.  183.  185. 3375900     185.
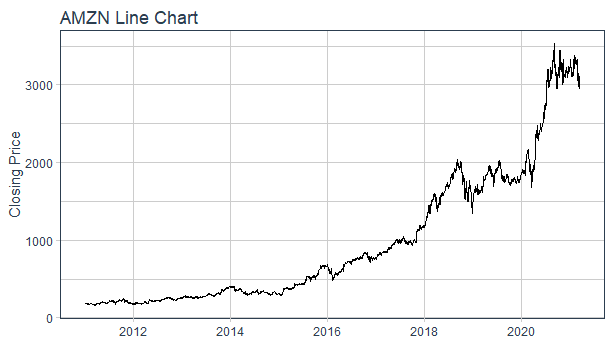
チャートを描いてみます。
AAPL %>%
    ggplot(aes(x = date, y = close)) +
    geom_line() +
    labs(title = "AAPL Line Chart", y = "Closing Price", x = "") +
    theme_tq()

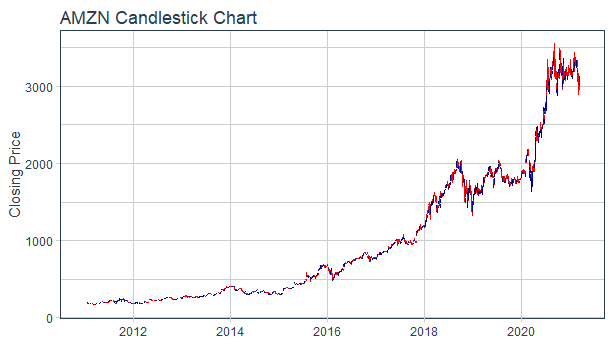
ロウソクチャートも描けます。
amzn_prices %>%
  ggplot(aes(x = date, y = close)) +
  geom_candlestick(aes(open = open, high = high, low = low, close = close)) +
  labs(title = "AMZN Candlestick Chart", y = "Closing Price", x = "") +
  theme_tq()

4. さいごに
もちろんチャートだけではなく、様々な解析をおkなう関数もありますが、今日はここまで。
