【R】pdplot2
2021年3月26日
1. はじめに
`pdplot2は、ggplotを使って確率密度関数をプロットするWrapperです。表示できる確率密度分布は、normal, logistic, binomial, chi-square, poisson, exponential, cauchy, beta, gamma, geometric, Student's t そして Fです。
2. インストール
Githubからインストールします。
devtools::install_github("tegedik/pdplot2")3. 使ってみる
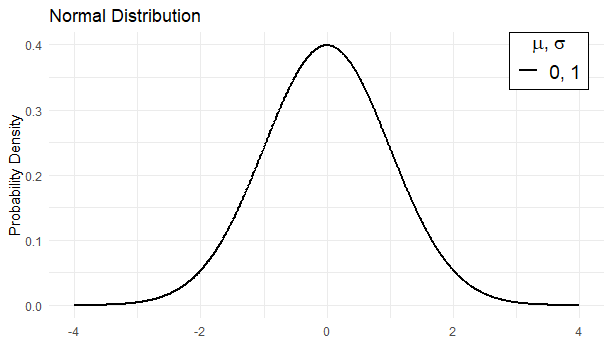
平均0,標準偏差1の正規分布のプロットです。
pdplot2(seq(-4, 4, 0.01), mean=0, sd=1, type="normal")

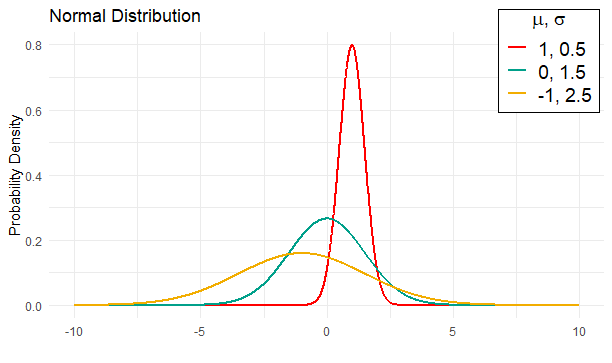
複数のプロットを重ねて色を付けることもできます。
pdplot2(seq(-10, 10, 0.01), mean=c(1,0,-1), sd=c(0.5,1.5,2.5), type="normal", show.color=TRUE)

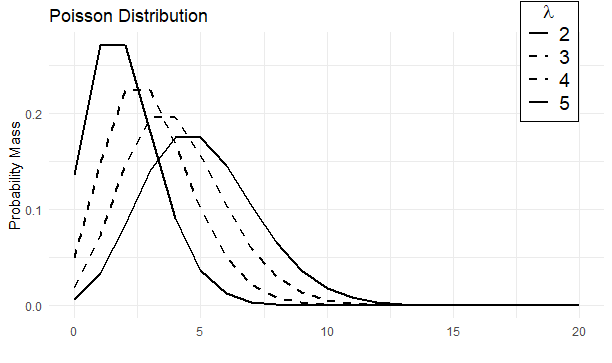
線の種類も変えられます。
pdplot2(0:20, lambda=2:5, type="poisson", line.selection=TRUE,
        linetype=c("solid", "dashed", "dashed", "solid"))

4. さいごに
手軽にプロットできるのが良いですね。
