【R】cobalt
2021年4月11日
1. はじめに
cobaltは、Covariate Balance Tables (and Plots)を意味して、balance table を評価するパッケージです。
2. インストール
CRANからインストールできます。
install.packages("cobalt")3. つかってみる
例にあるものをそのまま使ってみます。
library("cobalt")
library("MatchIt")
data("lalonde", package = "cobalt")

m.out <- matchit(treat ~ age + educ + race + married + nodegree + re74 + re75, data = lalonde)

bal.tab(m.out, thresholds = c(m = 0.1), un = TRUE)
Call
 matchit(formula = treat ~ age + educ + race + married + nodegree +
    re74 + re75, data = lalonde)

Balance Measures
                Type Diff.Un Diff.Adj        M.Threshold
distance    Distance  1.7941   0.9739
age          Contin. -0.3094   0.0718     Balanced, <0.1
educ         Contin.  0.0550  -0.1290 Not Balanced, >0.1
race_black    Binary  0.6404   0.3730 Not Balanced, >0.1
race_hispan   Binary -0.0827  -0.1568 Not Balanced, >0.1
race_white    Binary -0.5577  -0.2162 Not Balanced, >0.1
married       Binary -0.3236  -0.0216     Balanced, <0.1
nodegree      Binary  0.1114   0.0703     Balanced, <0.1
re74         Contin. -0.7211  -0.0505     Balanced, <0.1
re75         Contin. -0.2903  -0.0257     Balanced, <0.1

Balance tally for mean differences
                   count
Balanced, <0.1         5
Not Balanced, >0.1     4

Variable with the greatest mean difference
   Variable Diff.Adj        M.Threshold
 race_black    0.373 Not Balanced, >0.1

Sample sizes
          Control Treated
All           429     185
Matched       185     185
Unmatched     244       0
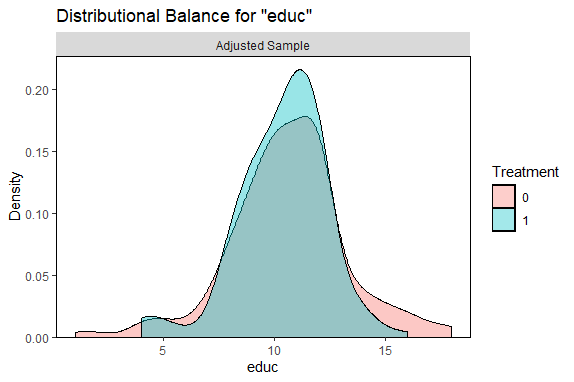
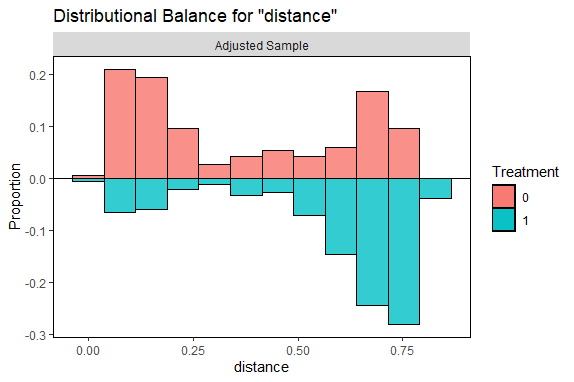
bal.plot(m.out, var.name = "educ") bal.plot(m.out, var.name = "distance", mirror = TRUE, type = "histogram")


4. さいごに
ちょっと時間がなくなったので、ここまで。
