【R】ヒストグラムに正規分布を重ねる方法
2021年6月29日
表題の方法がこちらに載っていたので、試してみた。
まずは、データを準備します。
library(tidyverse)
library(readr)

d <- read_csv("https://vincentarelbundock.github.io/Rdatasets/csv/openintro/speed_gender_height.csv")

d2 <-
  d %>%
  select(-gender)

d_summary <-
  d %>%
  group_by(gender) %>%
  summarise(height_m = mean(height, na.rm = T),
            height_sd = sd(height, na.rm = T))
-- Column specification -------------------------------------------------------------------------------------------------
cols(
  X1 = col_double(),
  speed = col_double(),
  gender = col_character(),
  height = col_double()
)
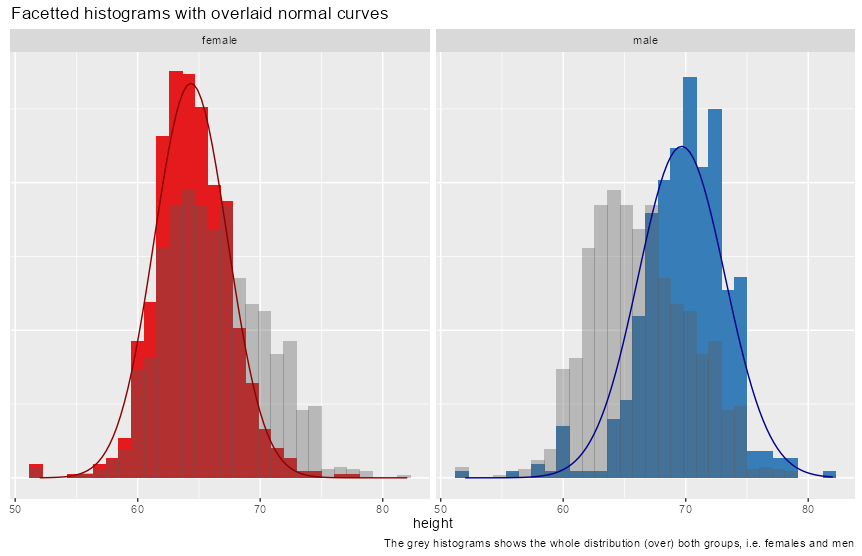
一番目は、手堅くggplotを使う方法。
d %>%
  ggplot() +
  geom_histogram(aes(y = ..density.., x = height, fill = gender)) +
  facet_wrap(~ gender) +
  geom_histogram(data = d2, aes(y = ..density.., x = height), alpha = .35) +
  stat_function(data = d_summary %>% filter(gender == "female"),
                fun = dnorm,
                color = "darkred",
                args = list(mean = filter(d_summary, gender == "female")$height_m,
                            sd = filter(d_summary, gender == "female")$height_sd)) +
  stat_function(data = d_summary %>% filter(gender == "male"),
                fun = dnorm,
                color = "darkblue",
                args = list(mean = filter(d_summary, gender == "male")$height_m,
                            sd = filter(d_summary, gender == "male")$height_sd)) +
  theme(legend.position = "none",
        axis.title.y = element_blank(),
        axis.text.y = element_blank(),
        axis.ticks.y = element_blank()) +
  labs(title = "Facetted histograms with overlaid normal curves",
       caption = "The grey histograms shows the whole distribution (over) both groups, i.e. females and men") +
  scale_fill_brewer(type = "qual", palette = "Set1")

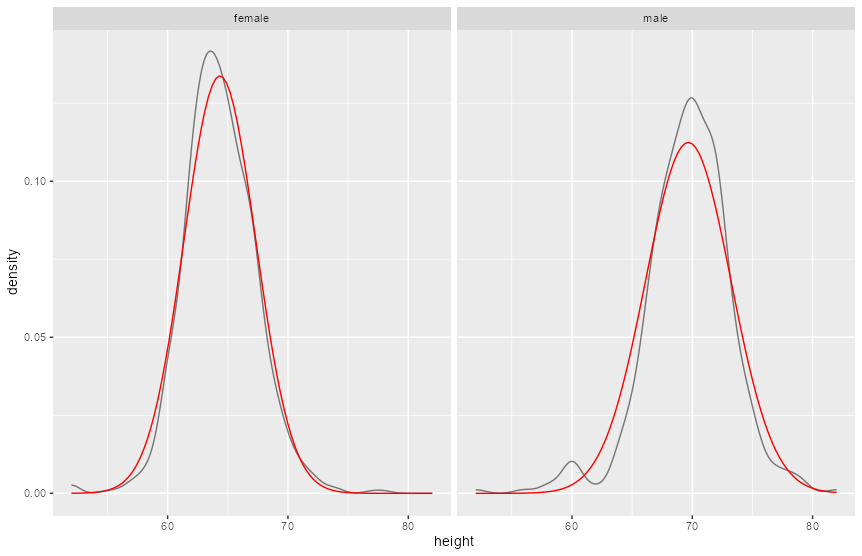
次は、ggformulaというパッケージを使う方法。とっても簡単です。
library(ggformula)
gf_dens( ~ height | gender, data = d) %>%
  gf_fitdistr(color = "red") %>%
  gf_fitdistr(dist = "normal", color = "blue")

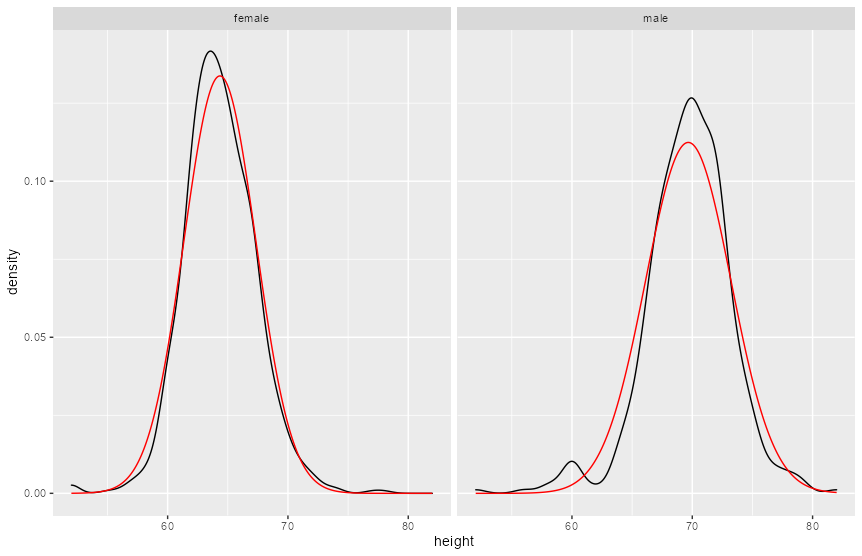
最後に、ggh4xというパッケージを使う方法。こちらも簡単!
library(ggh4x)
ggplot(d, aes(height)) +
  geom_density() +
  stat_theodensity(colour = "red") +
  facet_wrap(~ gender)


