【R】gganotate
2021年5月20日
1.はじめに
gganotateは、ggplotにアノテーションを付けてくれるパッケージです。
2. インストール
Githubからインストールします。
remotes::install_github("mattcowgill/ggannotate")3. つかってみる
基本的な使い方は、ggplotオブジェクトを作って、gganotate()関数を呼び出します。
下記のコードを実行するとダイアログが出てきて、
library(ggplot2)
library(ggannotate)


p <- ggplot(iris, aes(x = Sepal.Length, y = Sepal.Width, col=Species)) +
  geom_point()

ggannotate(p)
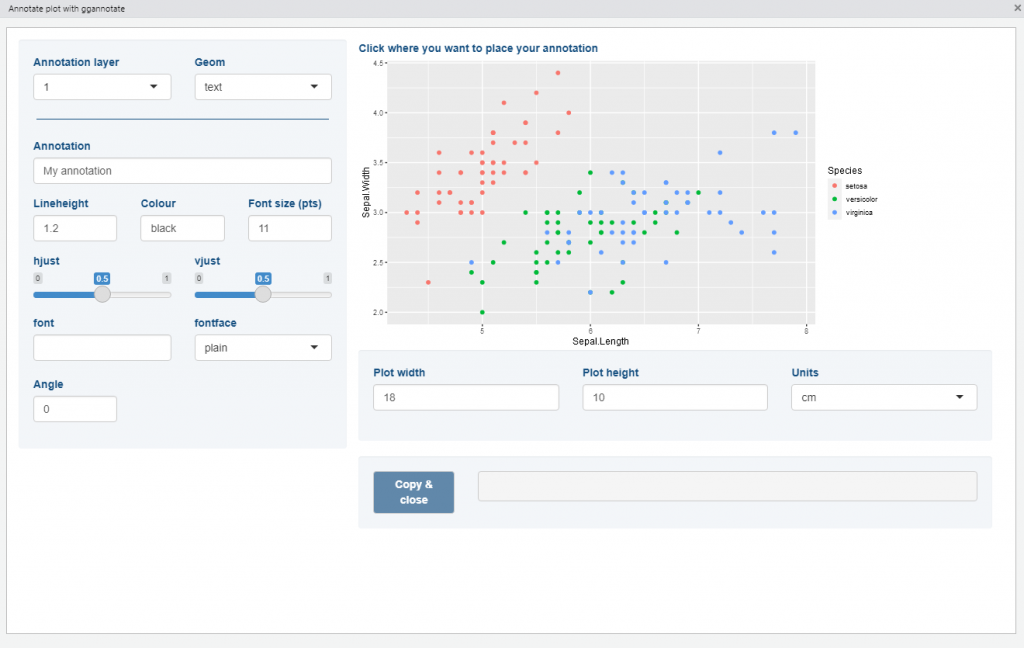
このダイアログ上でインタラクティブにアノテーションを設定できます。
最後に、下のテキストボックスに表示されているgeom_text()のコードをコピーすれば、再利用できます。
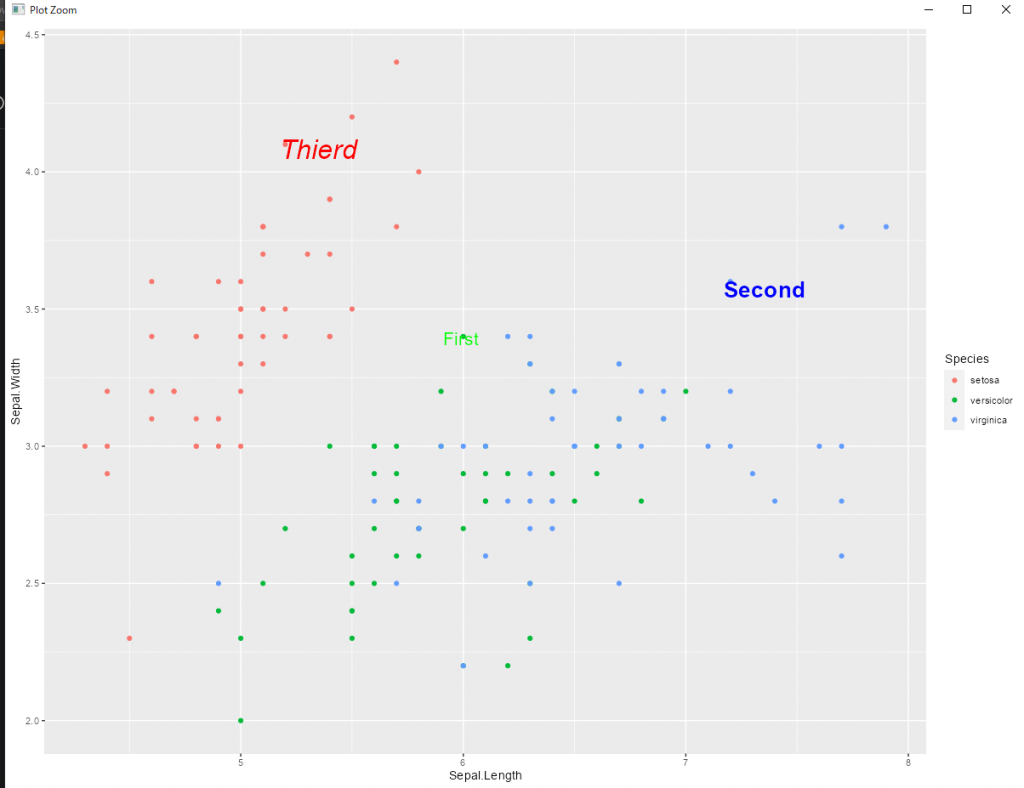
ggplot(iris, aes(x = Sepal.Length, y = Sepal.Width, col=Species)) +
  geom_point() +
  geom_text(data = data.frame(x = 5.22667183072467, y = 4.10365705982078, label = "Thierd"),
                          mapping = aes(x = x, y = y, label = label),
                          size = 8.47, hjust = 0.15, vjust = 0.8, colour = "red", fontface = 3, inherit.aes = FALSE) +
  geom_text(data = data.frame(x = 7.22459829289986, y = 3.59023492371034, label = "Second"),
            mapping = aes(x = x, y = y, label = label),
            size = 7.05, hjust = 0.15, vjust = 0.8, colour = "blue", fontface = 2, inherit.aes = FALSE) +
  geom_text(data = data.frame(x = 5.98999772617568, y = 3.37241947202712, label = "First"),
            mapping = aes(x = x, y = y, label = label),
            size = 5.64, vjust = 0.1, colour = "green", inherit.aes = FALSE)
4. さいごに
インタラクティブに結果を見ながらアノテーションを設定できるので非常に助かりますね。
