【R】ロジスティック回帰とその評価
ロジスティック回帰は、「分類」問題の解決手法の一つで一般化線形モデル(GLM : Generalized Linear Model)の一種で線形回帰を拡張して分類問題に対応できるようにしたものです。データ中心方式ではなく、構造化モデル方式を用い、計算速度が速く、新たなデータを適用しやすい特徴があるようです。
扱うデータは、投資者が資金をプールして個人ローンを提供するソーシャルレンディング業界のリーダー的な存在のLendingClubの個人ローンデータの一部を用います(loan_data.csv)。分析の目的は、返済可能と返済不可能を予測するモデルを評価することです。
まず、データを読み込みます。
library(MASS)
library(dplyr)
library(ggplot2)
library(FNN)
library(mgcv)
library(rpart)


loan_data <- read.csv('loan_data.csv.gz')

str(loan_data)
> str(loan_data)
'data.frame':	45342 obs. of  21 variables:
 $ X                : int  1 2 3 4 5 6 7 8 9 10 ...
 $ status           : chr  "Charged Off" "Charged Off" "Charged Off" "Charged Off" ...
 $ loan_amnt        : int  2500 5600 5375 9000 10000 21000 6000 15000 5000 5000 ...
 $ term             : chr  "60 months" "60 months" "60 months" "36 months" ...
 $ annual_inc       : int  30000 40000 15000 30000 100000 105000 76000 60000 50004 100000 ...
 $ dti              : num  1 5.55 18.08 10.08 7.06 ...
 $ payment_inc_ratio: num  2.39 4.57 9.72 12.22 3.91 ...
 $ revol_bal        : int  1687 5210 9279 10452 11997 32135 5963 5872 4345 74351 ...
 $ revol_util       : num  9.4 32.6 36.5 91.7 55.5 90.3 29.7 57.6 59.5 62.1 ...
 $ purpose          : chr  "car" "small_business" "other" "debt_consolidation" ...
 $ home_ownership   : chr  "RENT" "OWN" "RENT" "RENT" ...
 $ delinq_2yrs_zero : int  1 1 1 1 1 1 1 1 0 1 ...
 $ pub_rec_zero     : int  1 1 1 1 1 1 1 1 1 1 ...
 $ open_acc         : int  3 11 2 4 14 7 7 7 14 17 ...
 $ grade            : num  4.8 1.4 6 4.2 5.4 5.8 5.6 4.4 3.4 7 ...
 $ outcome          : chr  "default" "default" "default" "default" ...
 $ emp_length       : int  1 5 1 1 4 11 2 10 3 11 ...
 $ purpose_         : chr  "major_purchase" "small_business" "other" "debt_consolidation" ...
 $ home_            : chr  "RENT" "OWN" "RENT" "RENT" ...
 $ emp_len_         : chr  " > 1 Year" " > 1 Year" " > 1 Year" " > 1 Year" ...
 $ borrower_score   : num  0.65 0.8 0.6 0.5 0.55 0.4 0.7 0.5 0.45 0.5 ...
目的変数は、outcomeでローン返済可能(paid off)なら0、返済不可能(default)なら1です。
では、GLMでモデルを作ってみます。
logistic_gam <- gam(outcome ~ s(payment_inc_ratio) + purpose_ +
                      home_ + emp_len_ + s(borrower_score),
                    data=loan_data, family='binomial')
summary(logistic_gam)
> summary(logistic_gam)

Family: binomial
Link function: logit

Formula:
outcome ~ s(payment_inc_ratio) + purpose_ + home_ + emp_len_ +
    s(borrower_score)

Parametric coefficients:
                           Estimate Std. Error z value Pr(>|z|)
(Intercept)                 0.02833    0.05702   0.497    0.619
purpose_debt_consolidation -0.24836    0.02763  -8.988  < 2e-16
purpose_home_improvement   -0.40994    0.04678  -8.763  < 2e-16
purpose_major_purchase     -0.23762    0.05395  -4.405 1.06e-05
purpose_medical            -0.51696    0.08705  -5.939 2.87e-09
purpose_other              -0.62777    0.03981 -15.768  < 2e-16
purpose_small_business     -1.22389    0.06344 -19.294  < 2e-16
home_OWN                   -0.04964    0.03805  -1.305    0.192
home_RENT                  -0.15788    0.02122  -7.441 1.00e-13
emp_len_ > 1 Year           0.35323    0.05264   6.711 1.94e-11

(Intercept)
purpose_debt_consolidation ***
purpose_home_improvement   ***
purpose_major_purchase     ***
purpose_medical            ***
purpose_other              ***
purpose_small_business     ***
home_OWN
home_RENT                  ***
emp_len_ > 1 Year          ***
---
Signif. codes:  0 ‘***’ 0.001 ‘**’ 0.01 ‘*’ 0.05 ‘.’ 0.1 ‘ ’ 1

Approximate significance of smooth terms:
                       edf Ref.df Chi.sq p-value
s(payment_inc_ratio) 7.664  8.578   1084  <2e-16 ***
s(borrower_score)    4.168  5.054   3011  <2e-16 ***
---
Signif. codes:  0 ‘***’ 0.001 ‘**’ 0.01 ‘*’ 0.05 ‘.’ 0.1 ‘ ’ 1

R-sq.(adj) =  0.113   Deviance explained = 8.59%
UBRE = 0.26815  Scale est. = 1         n = 45342
分類モデルを評価していきます。
実際のoutcomeであるYと予測した結果Yhatは次のように表(混同行列:Confusion matrix)に表されます。
             Yhat = Positive             Yhat = Negative
Y = True     "真陽性:True Positive(TP)"  "偽陰性:False Negative(FN)"
Y = Negative "偽陽性:False Positive(FP)" "真陰性:True Negative(TN)"
評価内容は、以下の通り。
正確度(accuracy):正しく分類された事例の割合 (TP+TN)/total
敏感度(sensitivity)(再現率):Trueが正しく分類された割合 TP/(y=1)
特異度(specificity):Falseが正しく分類された割合 TN/(y=0)
適合率(precision):予測したPositiveが実際にTrueであった割合 TP/(Yhat=1)
では、今回のモデルでは、どうでしょうか?
pred <- predict(logistic_gam, newdata=loan_data)
pred_y <- as.numeric(pred > 0)
true_y <- as.numeric(loan_data$outcome=='default')
true_pos <- (true_y==1) & (pred_y==1)
true_neg <- (true_y==0) & (pred_y==0)
false_pos <- (true_y==0) & (pred_y==1)
false_neg <- (true_y==1) & (pred_y==0)
conf_mat <- matrix(c(sum(true_pos), sum(false_pos),
                     sum(false_neg), sum(true_neg)), 2, 2)
colnames(conf_mat) <- c('Yhat = 1', 'Yhat = 0')
rownames(conf_mat) <- c('Y = 1', 'Y = 0')
conf_mat
> conf_mat
      Yhat = 1 Yhat = 0
Y = 1    14293     8378
Y = 0     8051    14620
# precision conf_mat[1, 1] / sum(conf_mat[,1]) # sensitivity conf_mat[1, 1] / sum(conf_mat[1,]) # specificity conf_mat[2, 2] / sum(conf_mat[2,])
> # precision
> conf_mat[1, 1] / sum(conf_mat[,1])
[1] 0.6396796
> # sensitivity
> conf_mat[1, 1] / sum(conf_mat[1,])
[1] 0.630453
> # specificity
> conf_mat[2, 2] / sum(conf_mat[2,])
[1] 0.6448767
その定義から、再現率と特異度の間には、トレードオフの関係にあります。Trueを多くするには、より多くのFalseを間違ってTrueとすることになるからです。理想的には、TrueとFalseを間違えないことです。
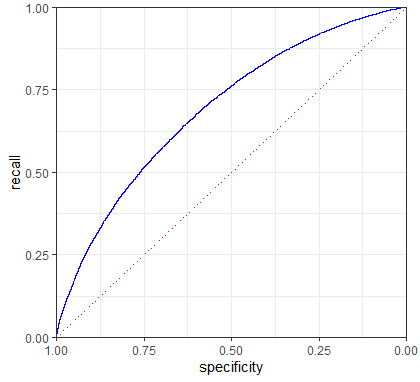
このトレードオフを把握する指標がROC(Receiver Operating Characteristics, 受信者動作特性)曲線です。再現率をy軸に、特異度をx軸にしてトレードオフを表示します。
idx <- order(-pred)
recall <- cumsum(true_y[idx] == 1) / sum(true_y == 1)
specificity <- (sum(true_y == 0) - cumsum(true_y[idx] == 0)) / sum(true_y == 0)
roc_df <- data.frame(recall = recall, specificity = specificity)

graph <- ggplot(roc_df, aes(x=specificity, y=recall)) +
  geom_line(color='blue') +
  scale_x_reverse(expand=c(0, 0)) +
  scale_y_continuous(expand=c(0, 0)) +
  geom_line(data=data.frame(x=(0:100) / 100), aes(x=x, y=1-x),
            linetype='dotted', color='red') +
  theme_bw() + theme(plot.margin=unit(c(5.5, 10, 5.5, 5.5), "points"))
graph

非常に効率的な分類は、右上に寄っているもので、TrueとFalseを間違えずに多くのTrueを正確に分類できることになります。このモデルでは、特異度を50%に抑える場合、再現率は75%となります。
ROC曲線を使って曲線下面積(AUC:Area Underneath the Curve)を求めると、分類性能の指標として使うことができます。ROC曲線の下側の面積でAUCが大きいほど分類性能が高いことになります。AUCが1であれば完全な分類ですべてのTrueを正しく分類されることになります。
sum(roc_df$recall[-1] * diff(1-roc_df$specificity))
> sum(roc_df$recall[-1] * diff(1-roc_df$specificity))
[1] 0.6926232