【R】penguinsデータをいろいろプロット
2021年6月7日
備忘録的に。
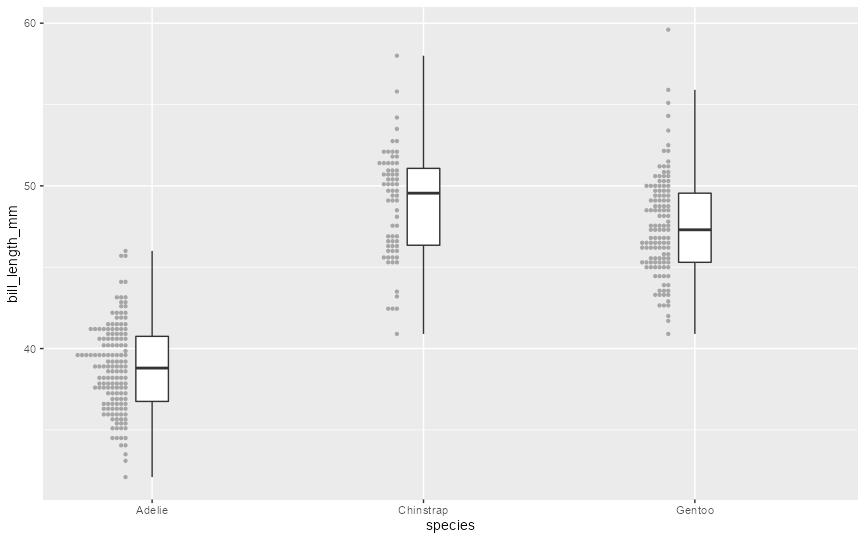
まずは、こちらのページを参考にさせてもらい、レインドロッププロット。
library(tidyverse)
library(ggplot2)
library(ggdist)
library(glue)
library(palmerpenguins)
data(package = 'palmerpenguins')

ggplot(penguins, aes(x = species, y = bill_length_mm)) +
  ggdist::stat_halfeye(
    adjust = .5,
    width = .6,
    .width = 0,
    justification = -.2,
    point_colour = NA
  ) +
  geom_boxplot(
    width = .12,
    outlier.shape = NA
  ) +
  ggdist::stat_dots(
    side = "left",
    justification = 1.1,
    binwidth = .25
  ) +
  coord_cartesian(xlim = c(1.2, NA))
なぜかうまく表示されない・・・。
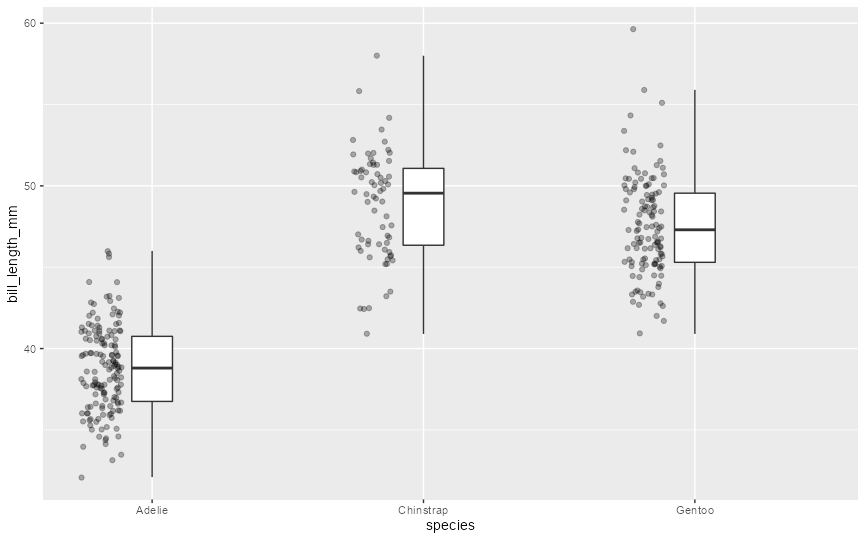
こちらもダメでした。
ggplot(penguins, aes(x = species, y = bill_length_mm)) +
  ggdist::stat_halfeye(
    adjust = .5,
    width = .6,
    .width = 0,
    justification = -.2,
    point_colour = NA
  ) +
  geom_boxplot(
    width = .15,
    outlier.shape = NA
  ) +
  gghalves::geom_half_point(
    side = "l",
    range_scale = .4,
    alpha = .3
  ) +
  coord_cartesian(xlim = c(1.2, NA), clip = "off")
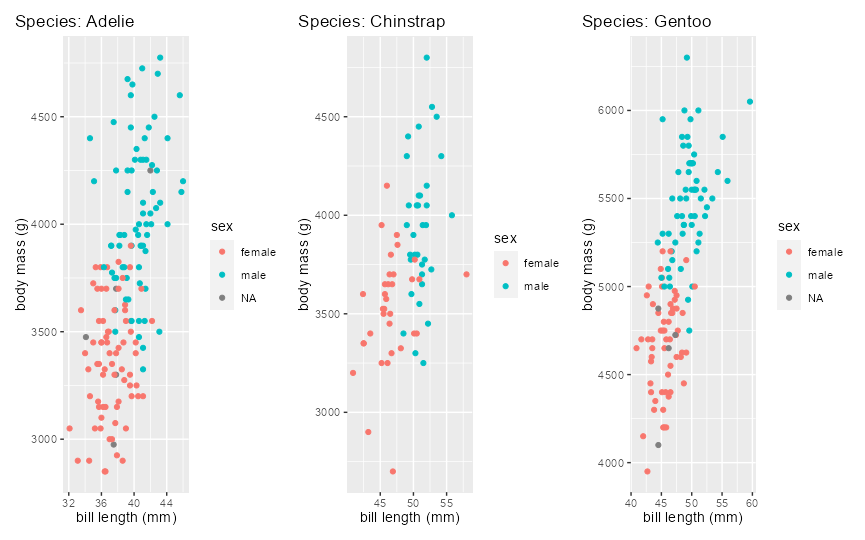
続いて、こちらのページを参考に、関数で複数のプロット
make_plot <- function(species) {
  penguins %>%
    filter(.data$species == .env$species) %>%
    ggplot() +
    aes(bill_length_mm, body_mass_g, color=sex) +
    geom_point() +
    ggtitle(glue("Species: {species}")) +
    xlab("bill length (mm)") +
    ylab("body mass (g)") +
    theme(plot.title.position = "plot")
}

make_plot("Adelie")

species <- c("Adelie", "Chinstrap", "Gentoo")
plots <- map(species, make_plot)

library(patchwork)

 plots[[1]] + plots[[2]] + plots[[3]]