【R】giscoR
2021年6月10日
1. はじめに
giscoRは、GISCO API.から様々な地理的データを取得するパッケージです。
2. インストール
CRANからインストールできます。
install.packages("giscoR")3. つかってみる
まず、例にあるようにアジアの地図を描いてみます。
library(giscoR)
library(sf)
library(tmap)


countries <- gisco_get_countries(region = "Asia")

tmap_style("classic")

tm_shape(countries) +
  tm_graticules(lines = FALSE) +
  tm_polygons() +
  tm_credits(gisco_attributions(copyright = "FALSE")) +
  tm_layout(main.title = "Countries of Asia",
            attr.outside = TRUE)
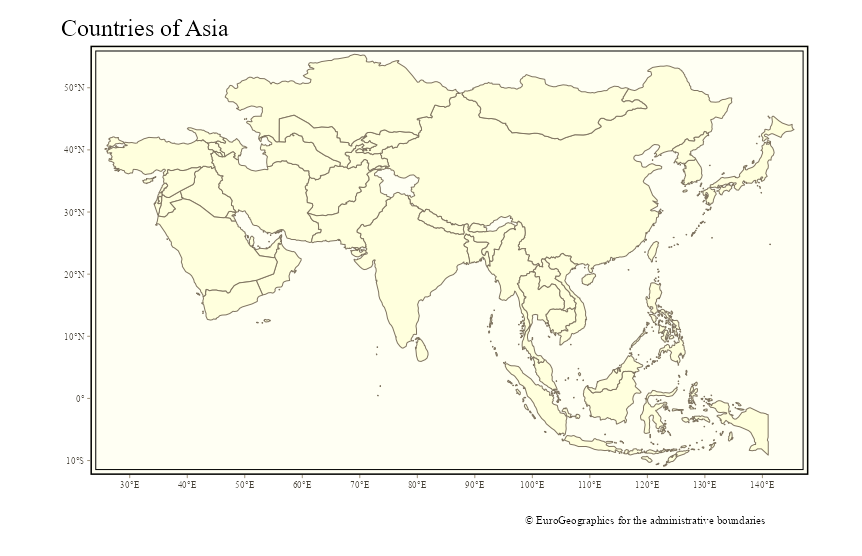
簡単に、キレイに描けますね!
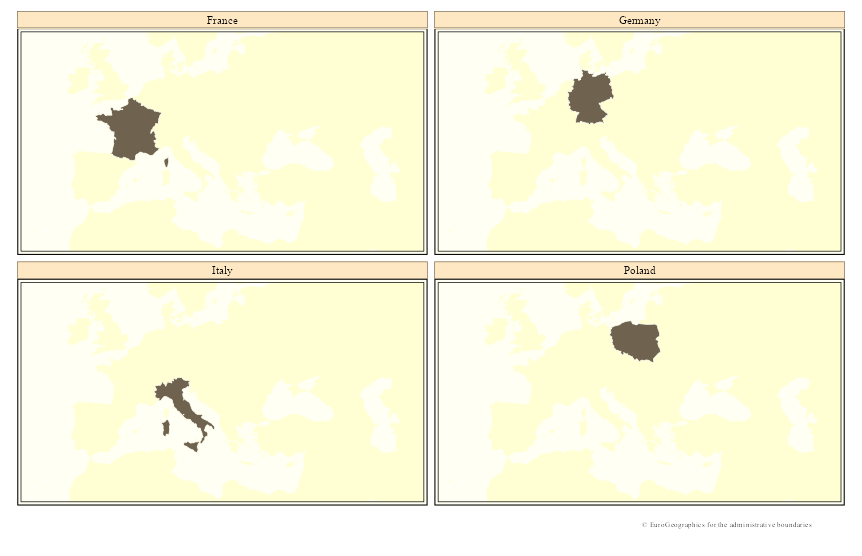
ヨーロッパの一部の地図を国ごとに色分けして表示してみます。
eu_part <-
  gisco_get_countries(
    country = c("France", "Germany", "Italy", "Poland"),
    resolution = "20",
    epsg = "4326",
    year = "2016"
  )


coast <- gisco_get_coastallines(resolution = "20",
                                epsg = "4326",
                                year = "2016")

tm_shape(coast, bbox = c(0, 30, 40, 60)) +
  tm_fill(col = "grey80")  +
  tm_shape(eu_part) +
  tm_polygons(col = "grey30", border.col = "white")  +
  tm_facets(by = "NAME_ENGL") +
  tm_credits(gisco_attributions(copyright = "FALSE"),
             position = c("right", "bottom")) +
  tm_layout(attr.outside = TRUE)
4. さいごに
簡単にデータの取得ができます!
