【R】Bubble chart
2021年6月20日
備忘録的にRでBubble charを描く方法です。こちらのサイトを参考にさせていただきました。
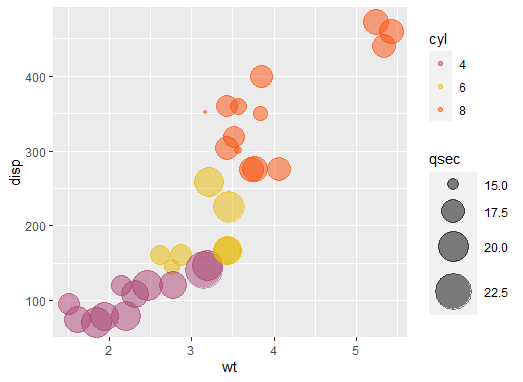
まずは、ggplotにて描いてみます。
library(tidyverse)
library(ggplot2)

mtcars %>%
  mutate(cyl = as.factor(cyl)) %>%
  ggplot(aes(x = wt, y = disp)) +
  geom_point(aes(color = cyl, size = qsec), alpha = 0.5) +
  scale_color_manual(values = c("#AA4371", "#E7B800", "#FC4E07")) +
  scale_size(range = c(1, 13)) +
  theme_set(theme_bw() +theme(legend.position = "bottom"))
次にPlotlyを使ってみます。
library(plotly)

mtcars %>%
  mutate(cyl = as.factor(cyl)) %>%
  plot_ly(x = ~wt, y = ~disp,
                      text = ~cyl, size = ~qsec,
                      color = ~cyl, sizes = c(10, 50),
                      marker =
                        list(opacity = 0.7,
                             sizemode = "diameter")) %>% layout
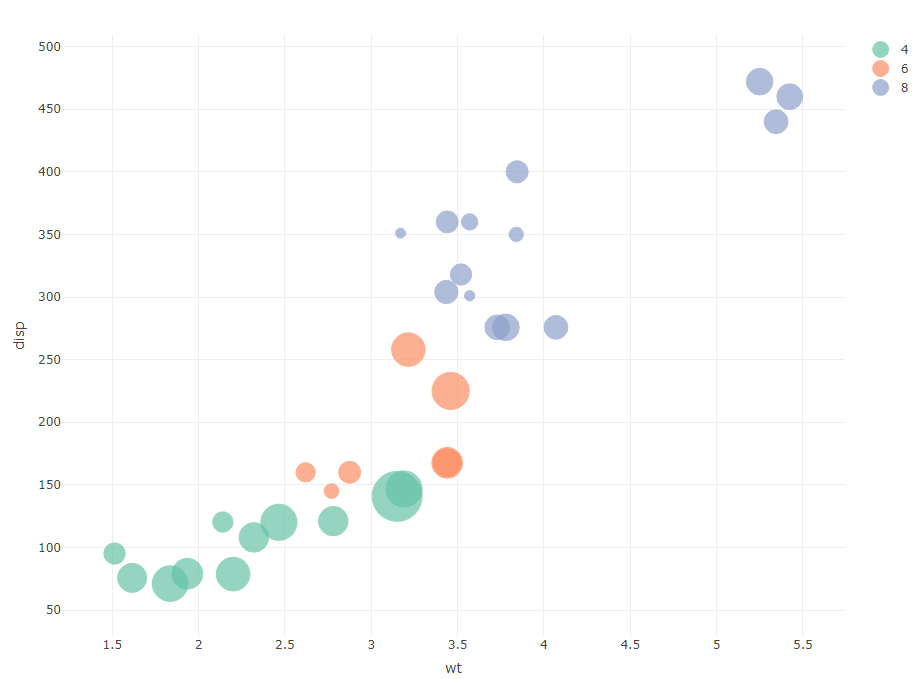
Plotlyなので、インタラクティブなグラフとなります。
忘れないようにしないと・・・。
