【R】areal
2021年6月27日
1. はじめに
arealは、地理情報のareal interpolationをしてくれるパッケージです。sfでも同様の機能があるのですが、こちらのほうが強力らしいです。
2. インストール
CRANからインストールできます。
install.packages("areal")3. つかってみる
主に2つの機能があり、接頭語で区別できます。
ar_– 多重内挿に使うデータや関数aw_– 地理的な重みで内挿する関数
データセットとしては、下記のものがパッケージに含まれています。
ar_stl_race(2017 ACS demographic counts at the census tract level; n = 106)ar_stl_asthma(2017 asthma rates at the census tract level; n = 106)ar_stl_wards(the 2010 political subdivisions in St. Louis; n = 28).ar_stl_wardsClipped(the 2010 political subdivisions in St. Louis clipped to the Mississippi River shoreline; n = 28).
パッケージに含まれているデータセットを使って、地理的な重み内挿をしてみます。
library(tidyverse)
library(ggplot2)
library(areal)
library(patchwork)

race <- ar_stl_race
asthma <- ar_stl_asthma
wards <- ar_stl_wards

g1 <- race %>%
  ggplot(aes(fill=TOTAL_E))+
  geom_sf()

g2 <- aw_interpolate(wards, tid = WARD, source = race, sid = "GEOID",
               weight = "sum", output = "sf", extensive = "TOTAL_E") %>%
  ggplot(aes(fill=TOTAL_E)) +
  geom_sf()

g1 + g2
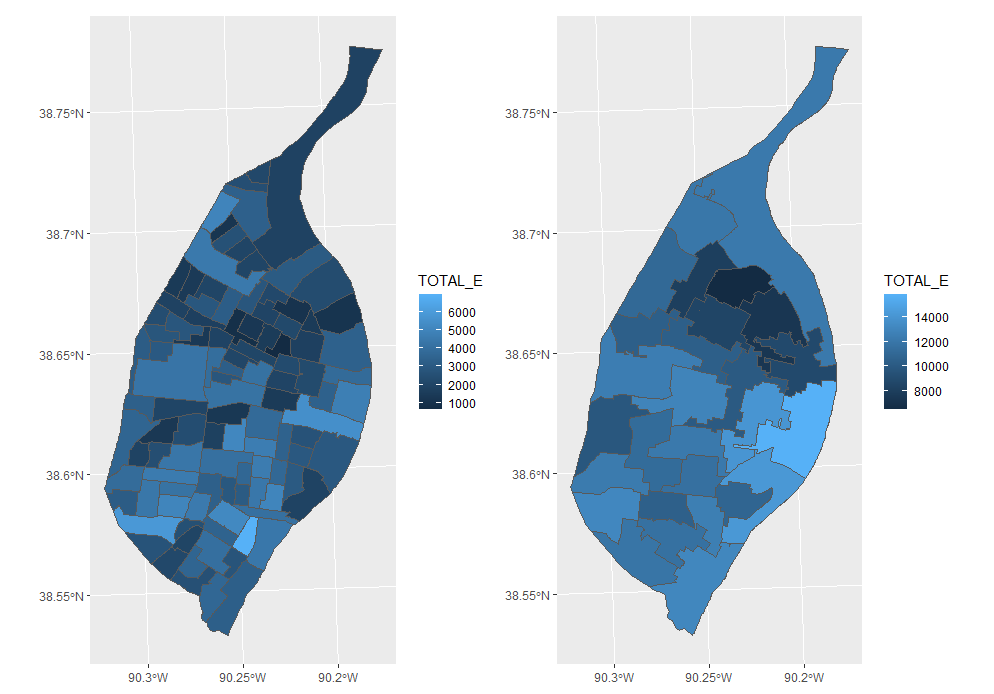
左が内挿前、右が内挿後のプロットです。
4. さいごに
まとめることで見えてくることもあります。
