【R】see
2021年7月19日
1. はじめに
seeは、ggplotの拡張機能で、モデル結果や診断解析の結果を、データに紐づけて可視化してくれるパッケージです。easystatsパッケージは、モデル化時のパフォーマンス等の結果を数値で出してくれますが、seeはそれを有効活用するパッケージです。
2. インストール
CRANからインストールできます。
install.packages("see")3. つかってみる
モデル化にしようする様々なパッケージをサポートしてくれています。主に、これだけのパッケージをサポートしているようです。
Plotting Functions for the ‘bayestestR’ Package
Plotting Functions for the ‘correlation’
PackagePlotting Functions for the ‘effectsize’ Package
Plotting Functions for the ‘modelbased’ Package
Plotting Functions for the ‘parameters’ Package
Plotting Functions for the ‘performance’ Package
例にあるものを確認してみます。
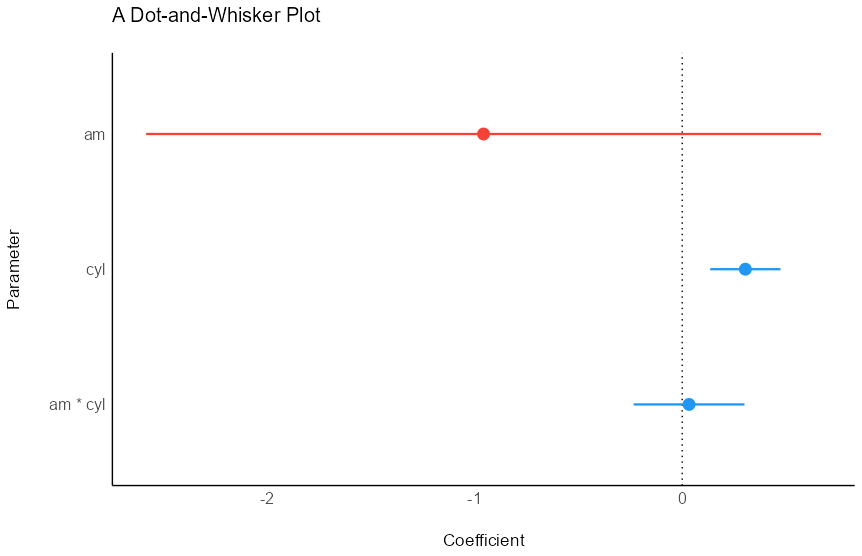
3.1 parameters パッケージ
library(parameters)
library(see)

model <- lm(wt ~ am * cyl, data = mtcars)

plot(parameters(model))+
  ggplot2::labs(title = "A Dot-and-Whisker Plot")
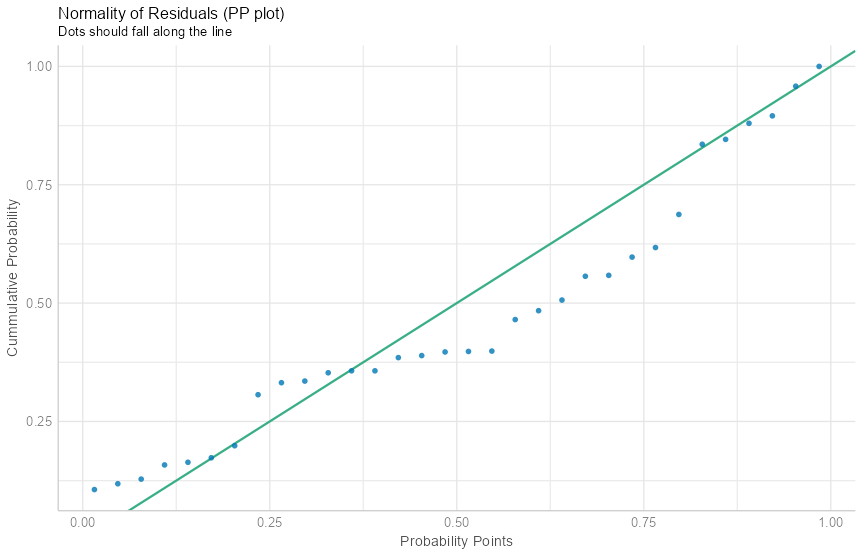
3.2 performance パッケージ
library(performance)
library(see)

model <- lm(hp ~ disp + mpg, data = mtcars)
check <- check_normality(model)

plot(check, type = "pp")
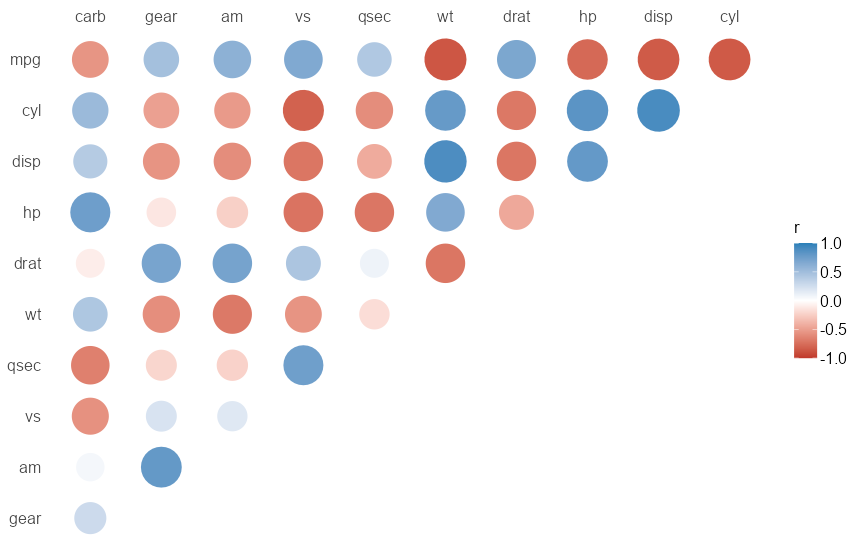
3.3 correlation パッケージ
library(correlation)
library(see)

results <- summary(correlation(mtcars))

plot(results)
4. さいごに
データに紐づけてちゃんとプロットしてくれるところがいいですね。この他、パレットやgeomなども提供されています。
