【R】cowplot
2021年8月17日
1. はじめに
cowplotは、ggplotのadd-onで、様々な機能を付加してくれます。Themeだったり、ちょっとした機能だったり、プロットの配置だったり。
2. インストール
CRANからインストールできます。
install.packages("cowplot")3. つかってみる
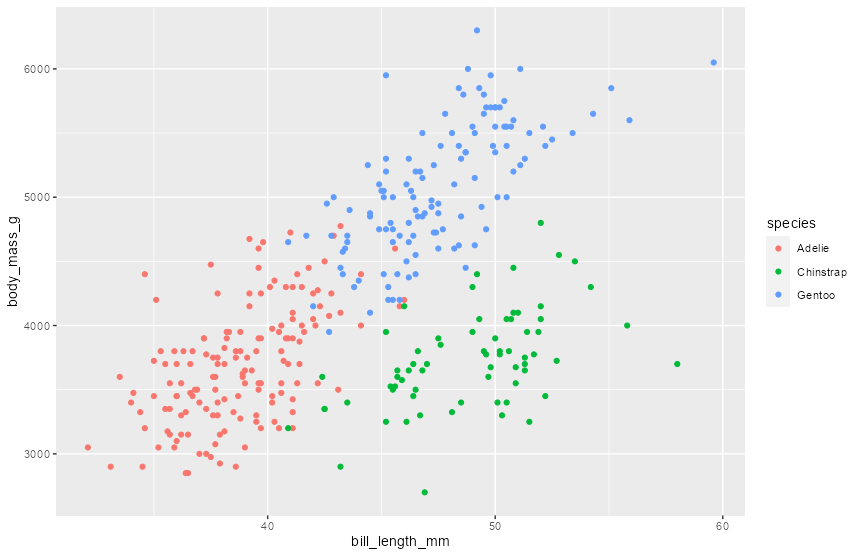
まずは、基本的な図をggplotでプロットします。
library(ggplot2)
library(cowplot)
library(modeldata)

data(penguins)

p <- ggplot(penguins, aes(bill_length_mm, body_mass_g, color = species)) +
  geom_point()
p
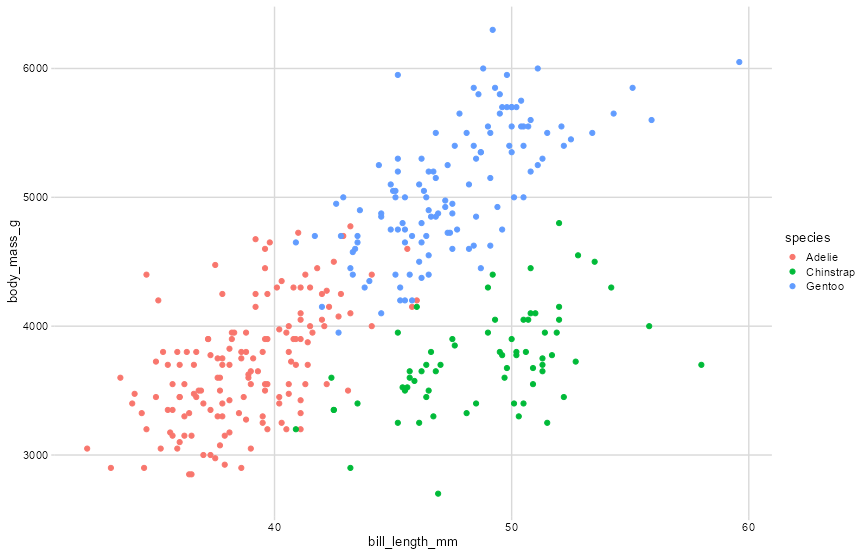
gridをつけます。
p + theme_minimal_grid(10)
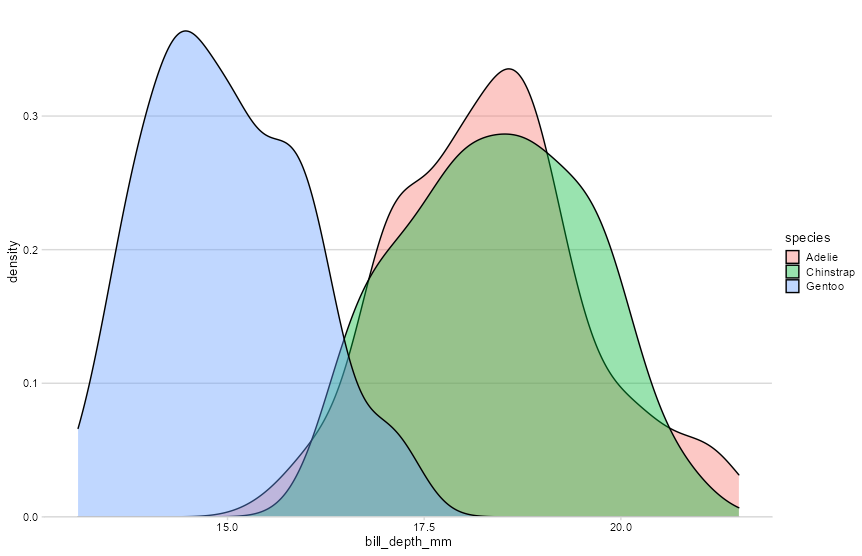
確率密度もこんな感じで。
ggplot(penguins, aes(bill_depth_mm, fill = species)) +
  geom_density(alpha = 0.4) +
  scale_y_continuous(expand = expansion(mult = c(0, 0.05))) +
  theme_minimal_hgrid(10)
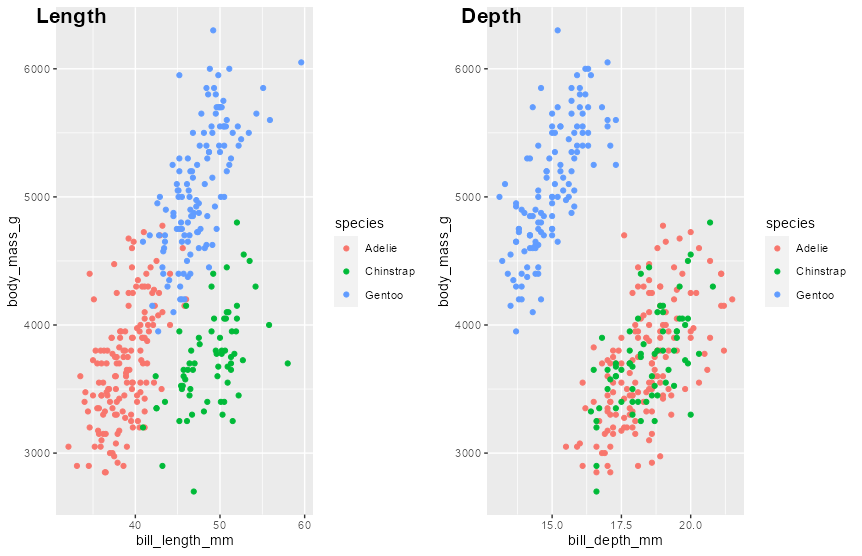
プロットの配置の制御もできます。
p1 <- ggplot(penguins, aes(bill_length_mm, body_mass_g, color = species)) +
  geom_point()

p2 <- ggplot(penguins, aes(bill_depth_mm, body_mass_g, color = species)) +
  geom_point()

plot_grid(p1, p2, labels = c('Length', 'Depth'), label_size = 16)
4. さいごに
ggplotがさらに便利になるパッケージです。
